- Transaction completions
- Feature usage
- Wallet connections
- Custom events specific to your app
How to analyze user retention
Retention analysis shows how many users come back to your app over time. This guide walks you through reading retention charts and improving user stickiness.What is a cohort retention chart?
A cohort is a group of users who started using your app in the same time period (e.g., users who first connected in Week 1). Retention tracks what percentage of each cohort returns in subsequent weeks.| Week 0 | Week 1 | Week 2 | Week 3 | Week 4 |
|---|---|---|---|---|
| 100% | 40% | 25% | 20% | 18% |
Step 1: Create a Retention chart
Retention is a chart type you add to a dashboard (board), not a separate nav page.- Go to the Formo Dashboard
- Select your project
- Open Dashboards in the left navigation, then open or create a board
- Click Add Chart and choose the Retention chart type
Step 2: Choose the retention event
Select which event defines “active” for retention tracking:| Event | What it measures |
|---|---|
| connect | Users who connected their wallet again |
| transaction | Users who transacted again |
| page | Users who visited any page |
| Custom event | Users who performed a specific action |
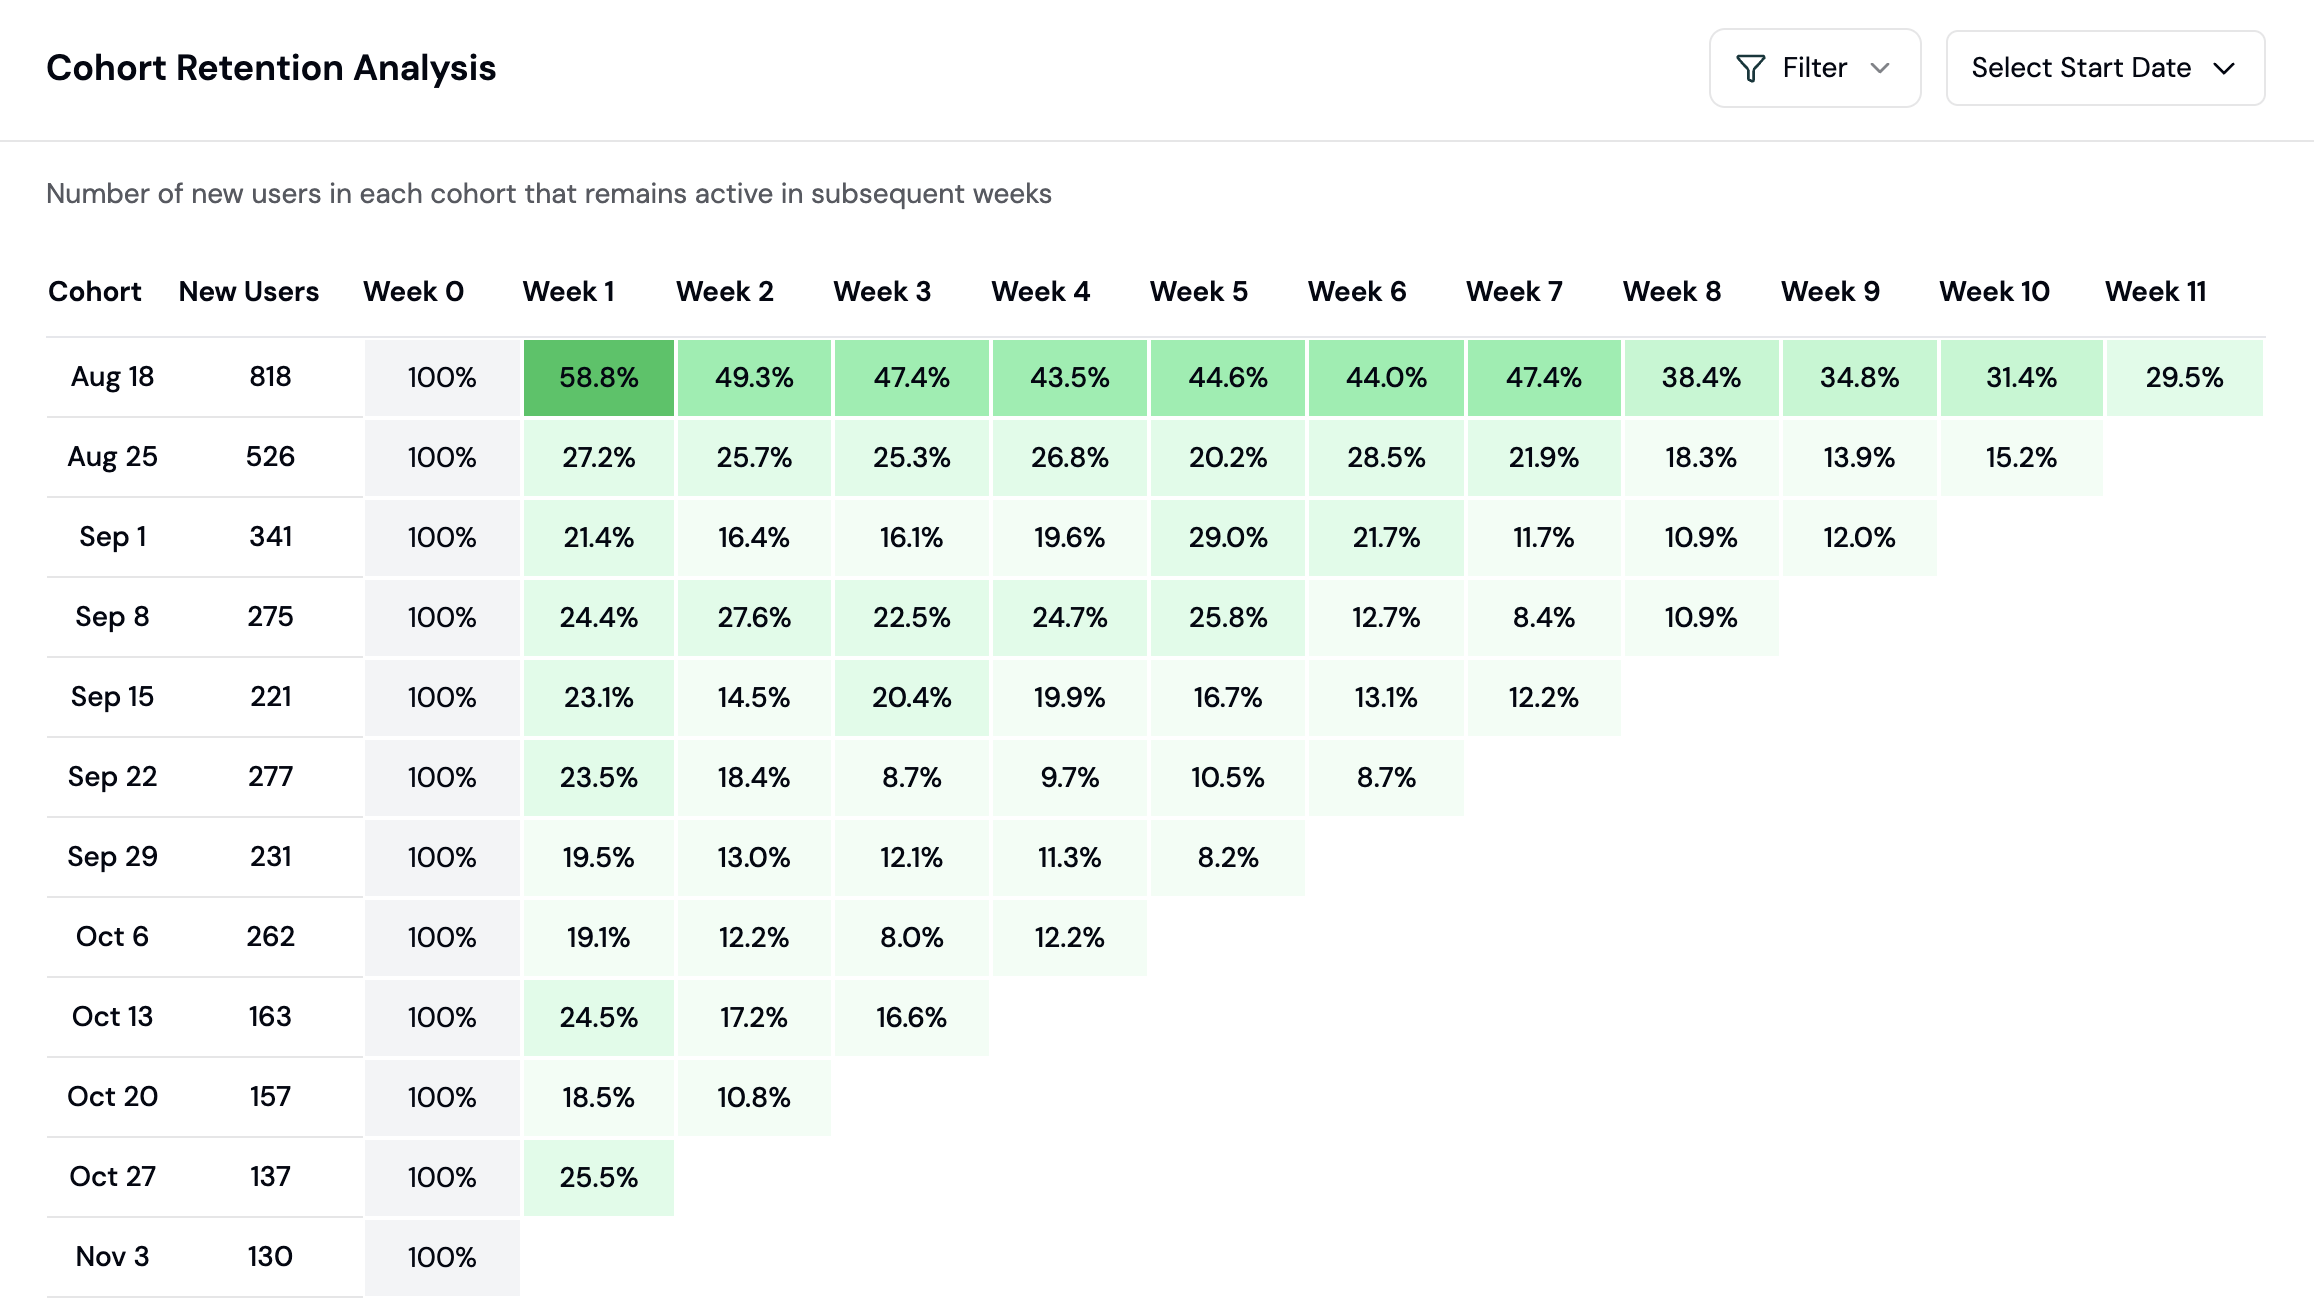
Step 3: Read the retention matrix
The retention chart displays:- Rows: Cohorts (grouped by start week/month)
- Columns: Time periods after start
- Cells: Percentage of cohort still active
- 🟢 Green = above average retention
- 🟡 Yellow = average retention
- 🔴 Red = below average retention
Step 4: Identify patterns
Healthy retention curve:- Sharp drop in Week 1 (normal)
- Gradual stabilization by Week 3-4
- Flat line after stabilization (loyal users)
- Continuous decline without stabilization
- Large drop-offs in later weeks
- Significant variance between cohorts
Step 5: Compare cohorts
Look for cohorts with better or worse retention: Questions to ask:- Did a product change improve retention for newer cohorts?
- Do users from certain campaigns retain better?
- Is there seasonal variation in retention?
Retention benchmarks for crypto apps
| App Type | Week 1 | Week 4 | Week 8 |
|---|---|---|---|
| DEX | 30-40% | 15-25% | 10-20% |
| Lending | 25-35% | 15-20% | 10-15% |
| Gaming | 35-50% | 20-30% | 15-25% |
Improving retention
Based on your retention analysis: If Week 1 drop-off is too high:- Improve onboarding experience
- Send follow-up notifications
- Add incentives for early engagement
- Add new features or content
- Implement re-engagement campaigns
- Analyze churned users for common patterns
- Identify what made them different
- Replicate successful acquisition channels
- Apply learnings to current users
Using retention with other features
| Feature | How to combine |
|---|---|
| Segments | Create segments of retained vs. churned users |
| Funnels | Measure conversion for retained users |
| Alerts | Get notified when retention drops |
| Wallet Profiles | Investigate high-retention users |
Next Steps
User Segments
Create segments based on retention behavior
DAU Tracking
Track daily active users
Wallet Profiles
Investigate churned users
Funnels
Analyze conversion for retained users