How it works
The Ask Formo feature provides an intelligent analytics assistant that can:- Generate queries: Ask questions in natural language and get SQL queries automatically generated
- Explore patterns: Discover trends and patterns in your data that might not be immediately obvious
- Surface anomalies: Identify unusual behavior or outliers in your metrics
- Recommend actions: Get actionable insights and recommendations based on your data
- Build charts: Create custom charts and save them to your dashboard
- Text to SQL: Write and fix SQL code based on your instructions
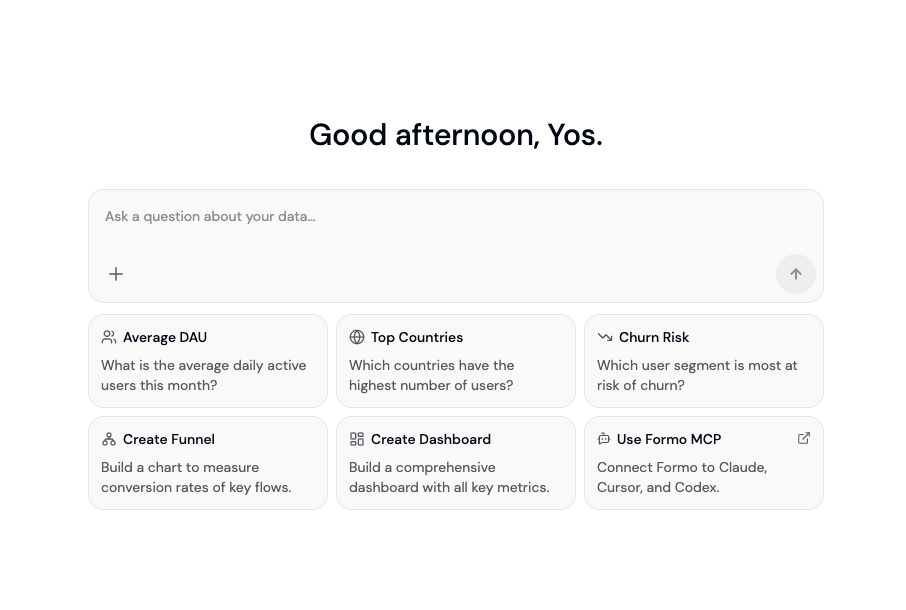
Access Ask Formo
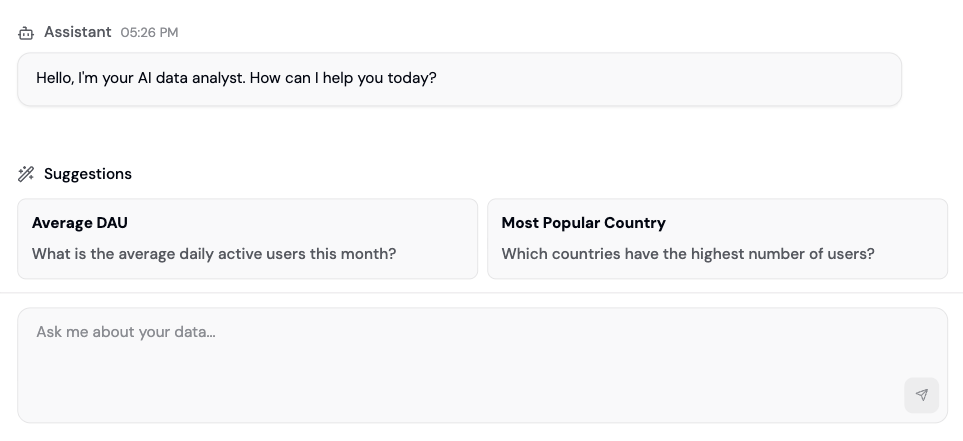
Use Ask Formo from anywhere on the dashboard. Ask it any question about your data, or ask it to draw custom charts for your dashboard.Getting started
- Click Ask Formo from anywhere in the dashboard
- Type your question in natural language, such as:
- “What are my top performing acquisition channels this month?”
- “Show me users who dropped off in the signup funnel”
- “Which wallets have the highest transaction volume?”
- “Are there any unusual patterns in my recent activity?”
- Review the generated query and results
- Save useful charts to your dashboard
Use cases
Data exploration
Ask Formo can help you explore your data without needing to know SQL or complex analytics queries. Simply describe what you want to understand, and the AI will generate the appropriate analysis.Pattern recognition
The AI can identify trends, seasonality, and patterns in your user behavior, transaction data, and conversion metrics that might be difficult to spot manually.Anomaly detection
Get alerts about unusual spikes, drops, or changes in your key metrics, along with potential explanations for what might be causing them.Actionable insights
Beyond just showing you data, Ask Formo provides context and recommendations for what actions you might take based on the insights discovered.Best practices
- Be specific: The more specific your questions, the better the AI can help you
- Provide context: Mention time periods, user segments, or specific metrics you’re interested in
- Follow up: Ask follow-up questions to dive deeper into interesting findings
- Validate insights: Always review the AI’s findings and validate important insights with your domain knowledge
- Specify time ranges: Use “in the last 7 days” instead of “recently”
- Name metrics clearly: Use “daily active wallets” instead of “users”
- Include thresholds: Use “net worth > $10,000” instead of “wealthy users”
- Ask for comparisons: Use “Compare X to Y” instead of “Show me X”
Sample questions
For a full list of example questions and prompts, see the How to use Ask Formo guide.Next Steps
How to use Ask Formo
Example questions and prompts
Chartbuilder
Build custom dashboards
Data Catalog
Understand available data
Funnels
Deep-dive on conversion
User Segments
Analyze specific user groups