

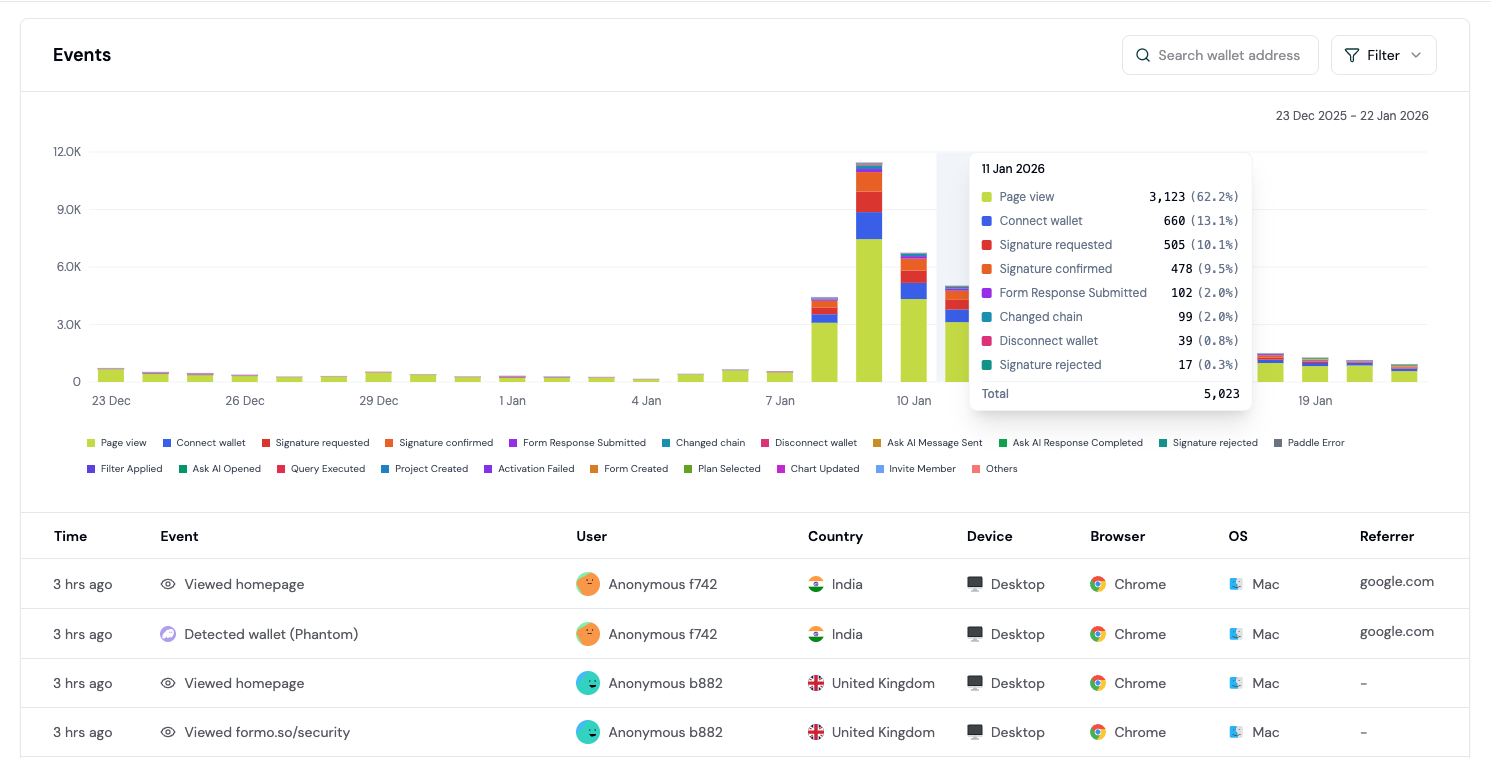
Every event, as it happens.
Filter by event properties
Filter the activity feed by event properties to focus on specific user actions or behaviors.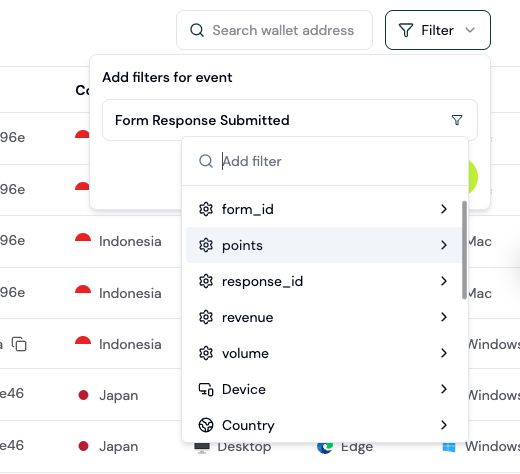
Filter by any property to understand what users are doing.
How to use the activity feed
This section covers using the Activity Feed for investigation and user research.Step 1: Open the Activity Feed
Go to the Formo Dashboard
Select your project
Click Activity in the left navigation
Step 2: Understand event types
Each event has a structured schema and type based on the event specs: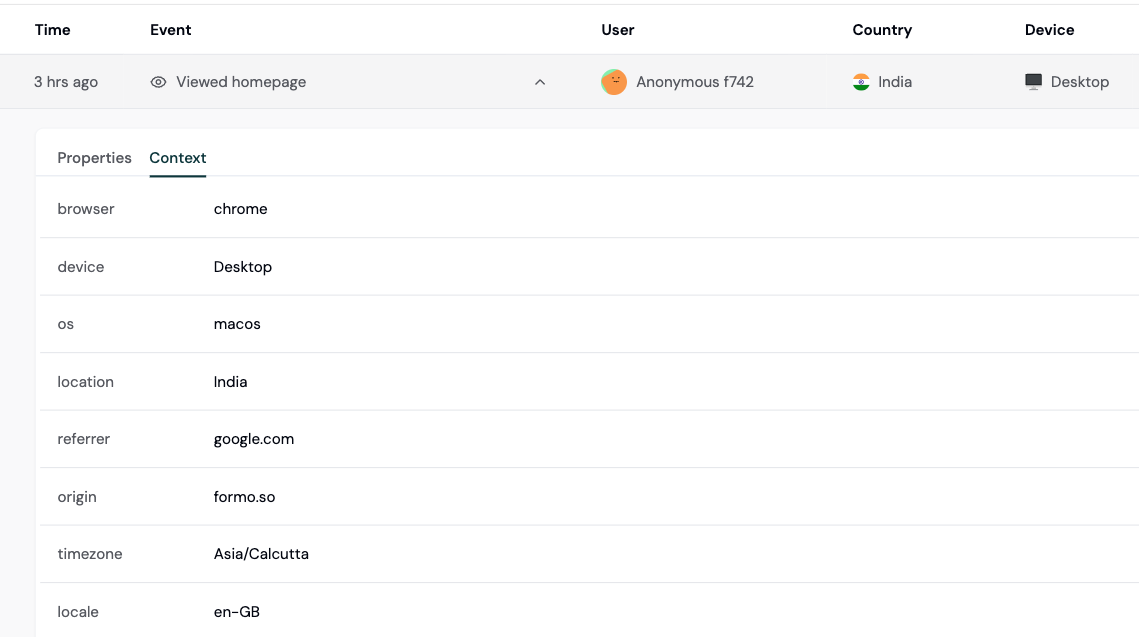
Each event has full properties and metadata available for deeper analysis.
Step 3: Filter to find specific events
Use filters to narrow down the feed:Click Filter
Choose a property to filter by
Set the condition and value
Filter by any property to focus your investigation.
Step 4: Investigate a user’s journey
To see everything a specific user did:Find any event from that user
Click the wallet address
View their complete Wallet Profile
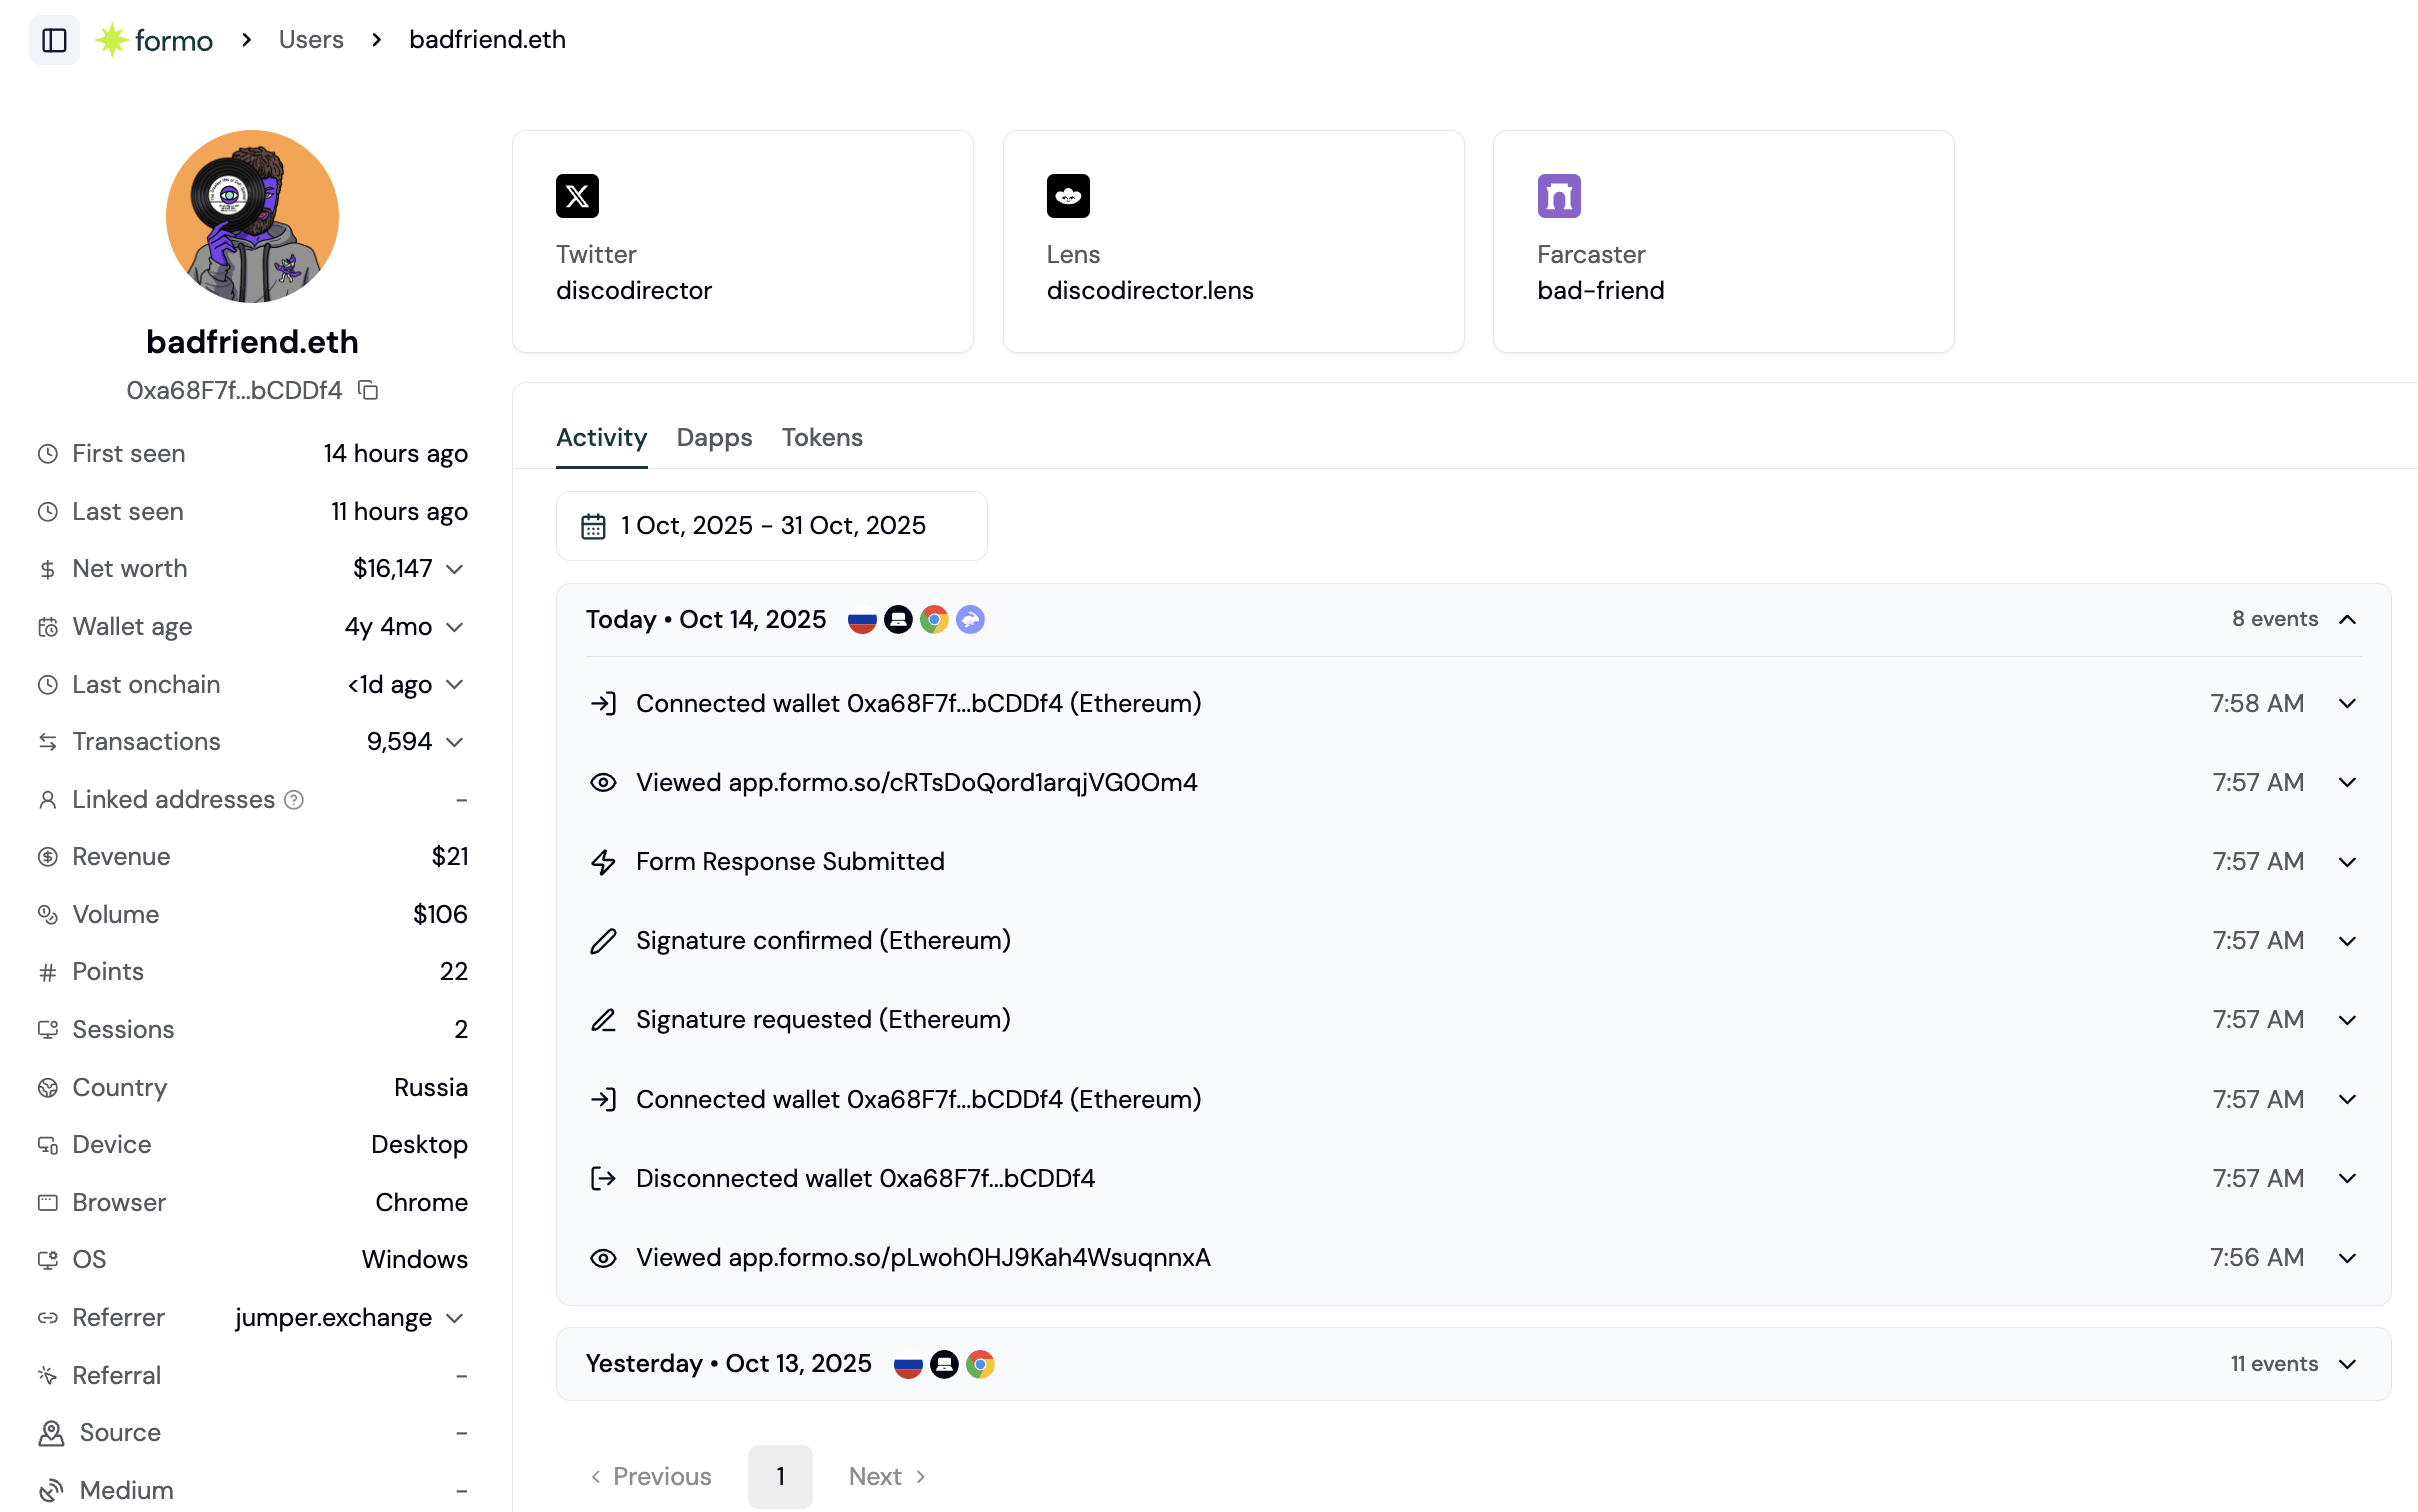
View a user's activity feed.
Use the search box
See all events from this user in chronological order
Step 5: Investigate issues
When users report problems, use the Activity Feed to investigate: Investigating a failed transaction:Filter by type = transaction
Look for the rejected status icon, or search by the user's address
Click to expand and see error details
Check the preceding events for context
Search by the user's address
Look at their event sequence
Identify where they stopped (last event before leaving)
Check for errors or unusual patterns
Use Funnels to measure drop-off rates at each step
Filter by a specific page
Look at what users do after visiting that page
Identify unexpected patterns
Use Flows to visualize common paths users take
Common investigation patterns
“Why are users bouncing from our swap page?”Filter: page = /swap
Look at events that follow page views
Count how many lead to connect vs. leaving
Check for errors or unusual device/browser patterns
Filter: type = transaction
Look for rejected transactions and expand each to review error details
Identify the most common failure reasons
Check if failures correlate with specific flows
Identify a power user from the Users list
Search Activity by their address
Study their event sequence
Compare to average user patterns
Filter by your custom event or page
See adoption over time
Check which user segments are using it
Look at the referrer to see how users find it