Create a funnel by adding steps to your crypto app and measuring the conversion rate at each step.
- Track page views, contract events, and custom events as funnel steps.
- Conversion rate: the percentage of visitors who completed the funnel.
- Drop-off rate: the percentage of visitors lost between each step.
- Filter funnels by campaign, traffic source, device, and more.
Conversion Windows
Specify a conversion window for your funnels to control the time period during which funnel steps must be completed. The default conversion window is 2 days, meaning all steps must be completed within that time. Longer windows will include more event completions.Step Order
Control whether funnel steps must be completed in sequence or in any order. This setting changes how Formo counts conversions and can significantly affect your reported numbers.Sequential (Closed Funnel)
Step B must happen after Step A, but any number of events can happen between A and B. This is the default and most common mode. Users must progress through your defined steps in order, but they can perform other actions in between. For example, in a funnel of Page View → Wallet Connect → Swap, a user who visits the page, browses other pages, connects their wallet, checks token prices, and then swaps would still count as converted.Seeing lower counts than expected in the sequential funnel? Users likely:
- Skipped steps in your defined funnel
- Completed steps in a different order
- Had multiple wallets/sessions where they completed different parts of the funnel
Any Order (Open Funnel)
Counts users who performed each event, regardless of sequence or timing. In this mode, users must complete all defined steps, but the order does not matter and the conversion window does not apply. Steps are matched across your full selected date range with no time constraint between them. The first step in your funnel could be the last action the user takes. This is useful when your funnel steps represent a set of actions rather than a linear journey. When to use each mode:Funnel Breakdowns
Break down funnel steps by key dimensions to understand how different user segments convert:- Device: Compare mobile vs desktop conversion performance
- Country: Understand geographic differences in conversion rates
- Browser: Compare conversion rates across browsers
- OS: Analyze conversion rates across operating systems
- Referrer: See which traffic sources drive the best conversions
- Referral: Compare conversion by referral code
- UTM Source, Medium, Campaign, Content, Term: Measure campaign performance across UTM parameters
- Builder Codes: Break down conversion by builder code
Conversion Insights
Insights surfaces which events or user properties are most strongly associated with conversion. We prioritize two key metrics to help you identify meaningful drivers:- Lift: Measures the impact of an event. A lift > 1 means users who perform the event are more likely to convert.
- Odds Ratio: Measures the strength of the association. Useful for verifying that an observed lift is not just due to random chance, especially for rare events.
Deep Dive: How is this calculated?
Deep Dive: How is this calculated?
2×2 Contingency TableAll insights are derived from a standard binary exposure vs. conversion table:
Key Metrics
- Lift
- Interpretation: Lift > 1 indicates a positive effect.
- Odds Ratio
- Interpretation: An Odds Ratio > 1 confirms a positive correlation.
- Low volume (fewer than 10 users).
- Negligible impact (less than 0.2% to 1.5% absolute difference depending on baseline conversion).
How to create your first funnel
Build a conversion funnel to track how users progress from first visit to onchain action. This guide walks you through creating, analyzing, and optimizing funnels.What is a funnel?
Think of a funnel like a kitchen funnel: wide at the top, narrow at the bottom. Users enter at the top (e.g., visiting your site) and progress through steps until some complete the final action (e.g., making a transaction). At each step, some users drop off. Funnels help you:- Measure conversion rates between steps
- Identify bottlenecks where users drop off
- Compare performance across segments (referrers, devices, countries)
Step 1: Create a Funnel chart
Funnels are a chart type you add to a dashboard (board), not a separate nav page.- Go to the Formo Dashboard
- Select your project
- Open Dashboards in the left navigation, then open or create a board
- Click Add Chart and choose the Funnel chart type
Step 2: Add funnel steps
Define the user journey you want to track. Click Add Step for each action:Step 3: Configure each step
For each step, specify: Page view steps:- Event type:
page - Filter:
path = /swap(or any URL path)
- Event type:
connect - Optional: filter by chain
- Event type:
transaction - Optional: filter by contract address or status
- Event type: Your contract event (e.g.,
Swap,Transfer) - Requires contract events to be configured
Step 4: Set the conversion window
Choose how long users have to complete all steps by entering a numeric value and selecting a unit (Hour, Day, or Week). The default is 2 days. Users must complete all steps within this window to count as converted. Note that the conversion window only applies to Sequential (Closed) funnels; Any Order (Open) funnels have no time constraint between steps.Step 5: Analyze your funnel
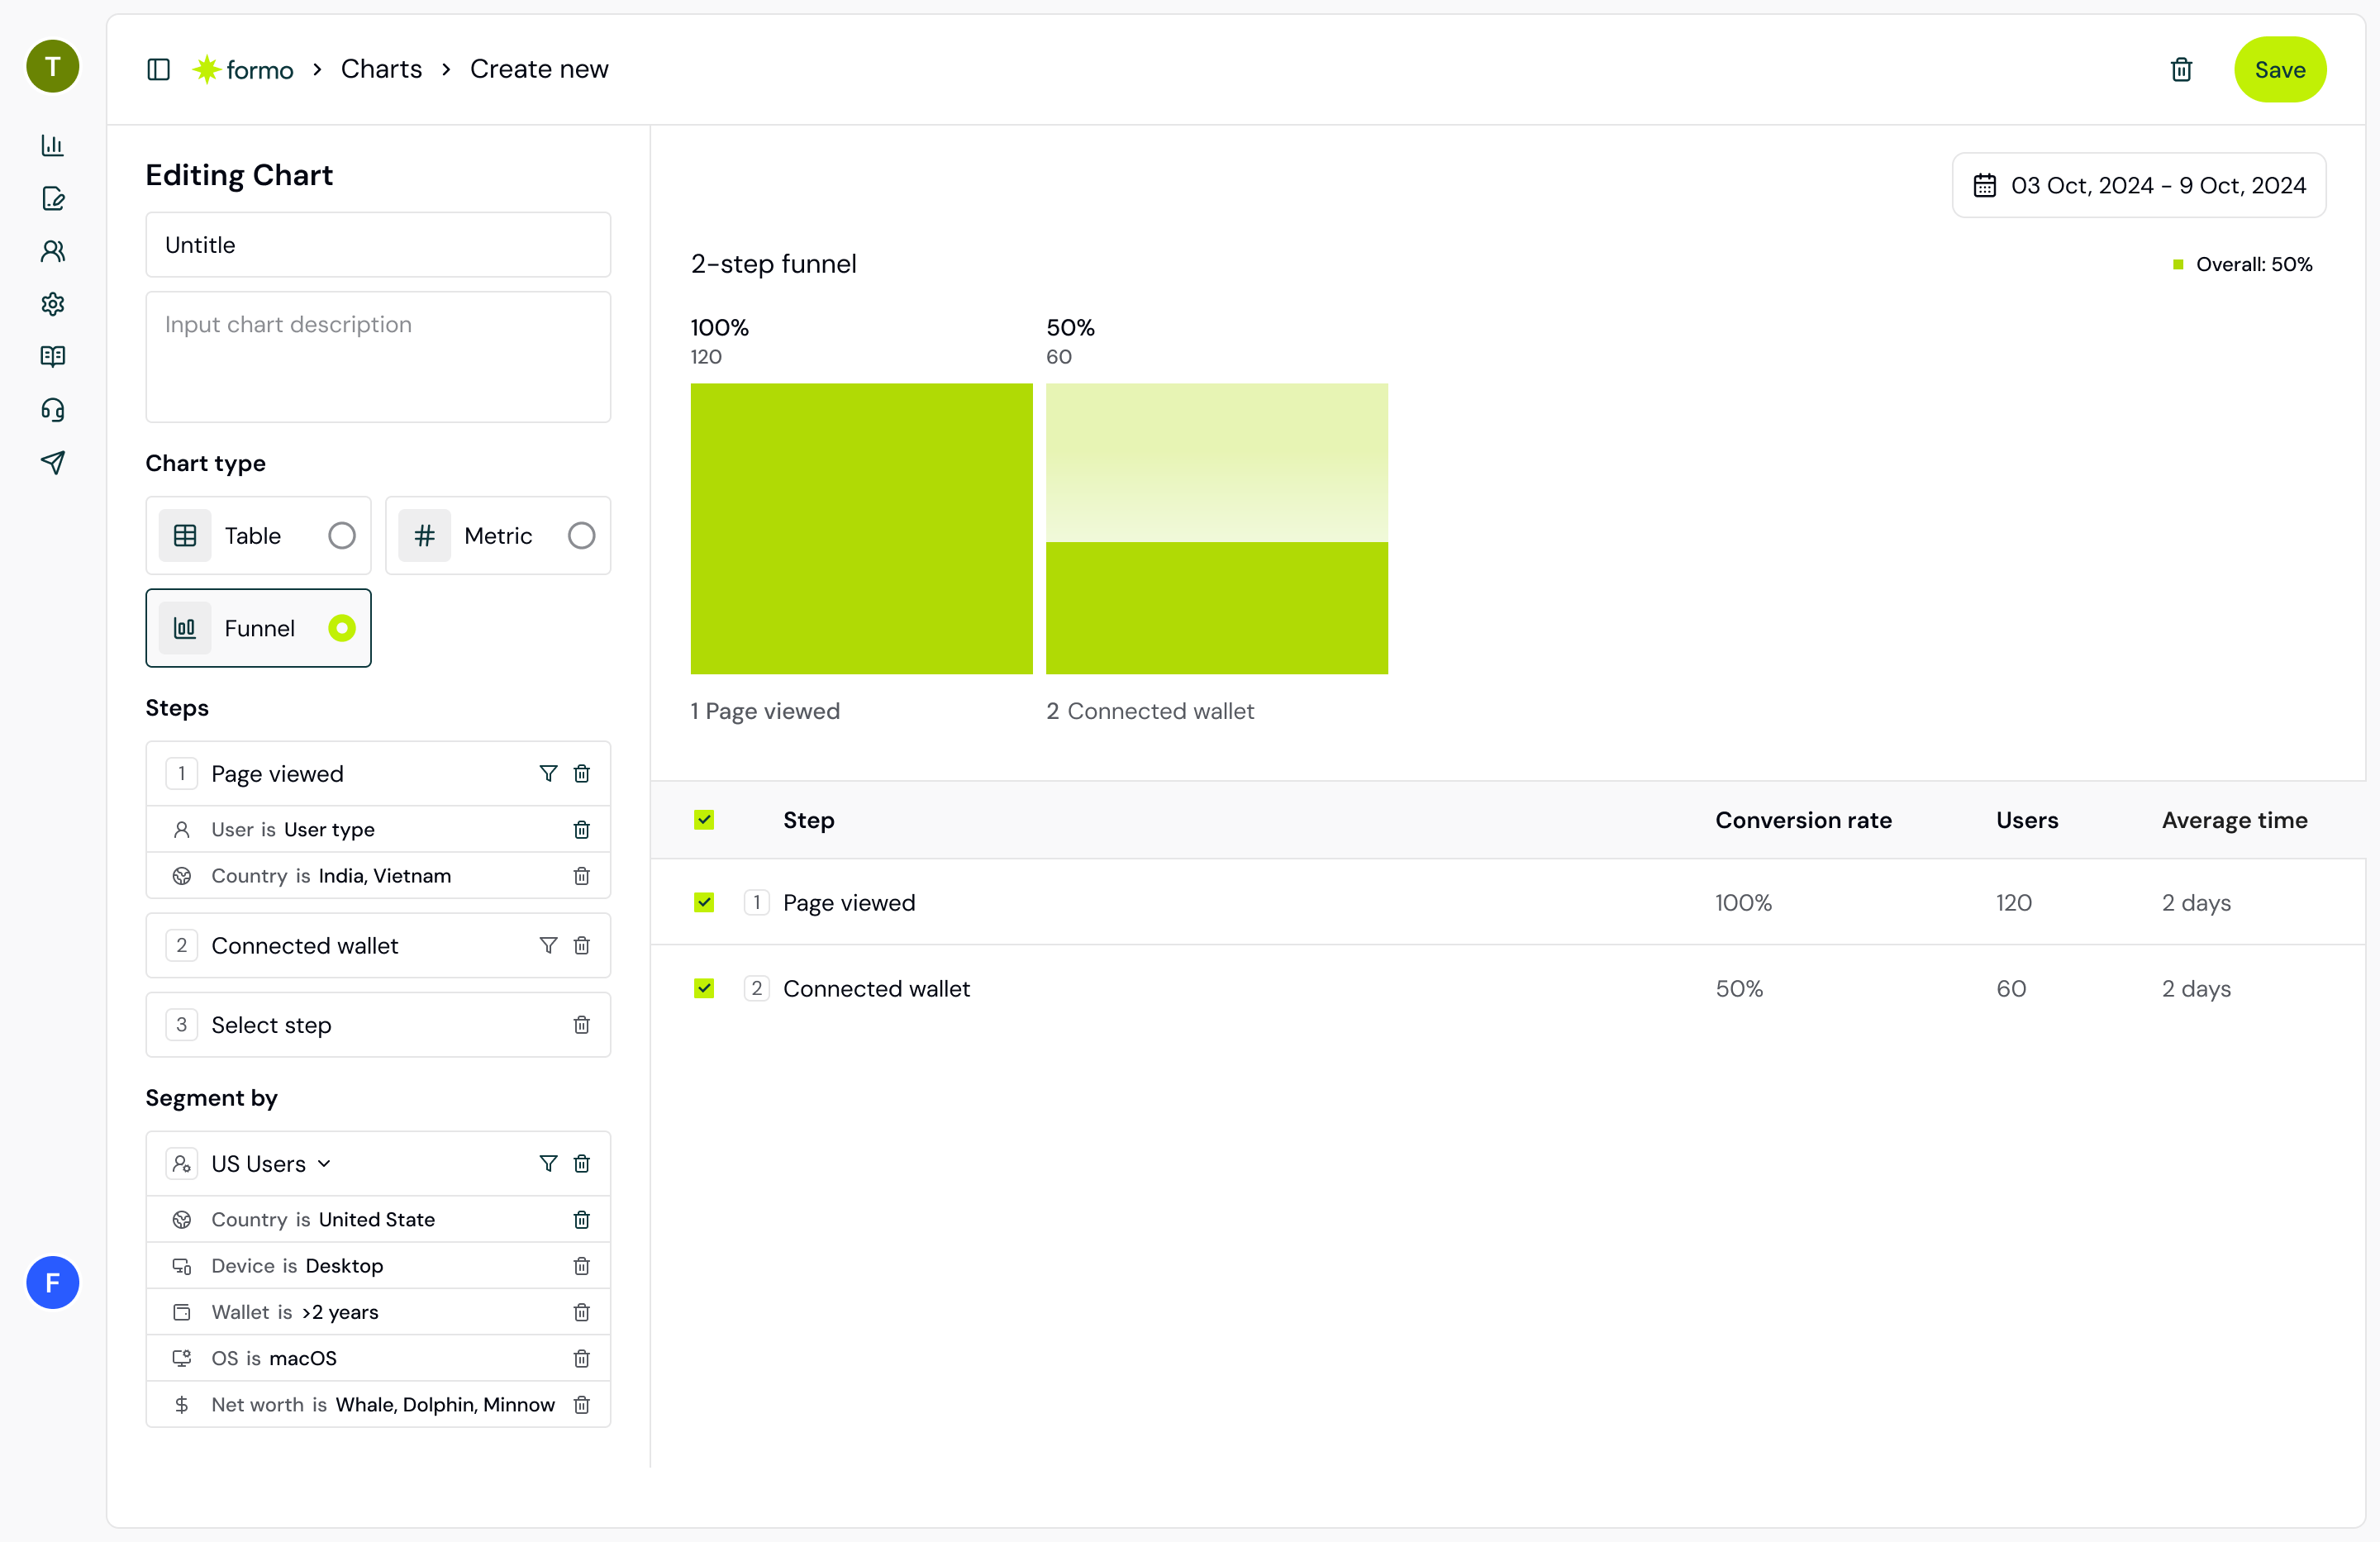
After creating your funnel, you’ll see:- Conversion rate - Percentage who completed all steps
- Drop-off by step - Where users abandon the journey
- Absolute numbers - User count at each step
Funnel visualization showing conversion rates and drop-off at each step.
Step 6: Add a breakdown
Select a dimension from Breakdown by to compare conversion across segments:Example: DEX swap funnel
Track users from landing to completed swap:
A big drop between steps 1 and 2 points to friction in the wallet connection step.
Using Conversion Insights
After running your funnel, go to the Insights page to see which user behaviors correlate with conversion:- High lift events: Users who did X are 2x more likely to convert
- Negative indicators: Users who did Y are 50% less likely to convert