The Explorer query editor lets you run SQL against your analytics data.
When to use the Explorer
Use the Explorer when you need:- Ad-hoc analysis for specific questions
- Custom calculations that aren’t available in standard dashboards
- Complex joins across multiple data types
- Testing queries for custom charts and dashboards
- Data validation to verify metrics
How to use the explorer
Step 1: Open the Explorer
- Go to the Formo Dashboard
- Select your project
- Click Explorer in the left navigation
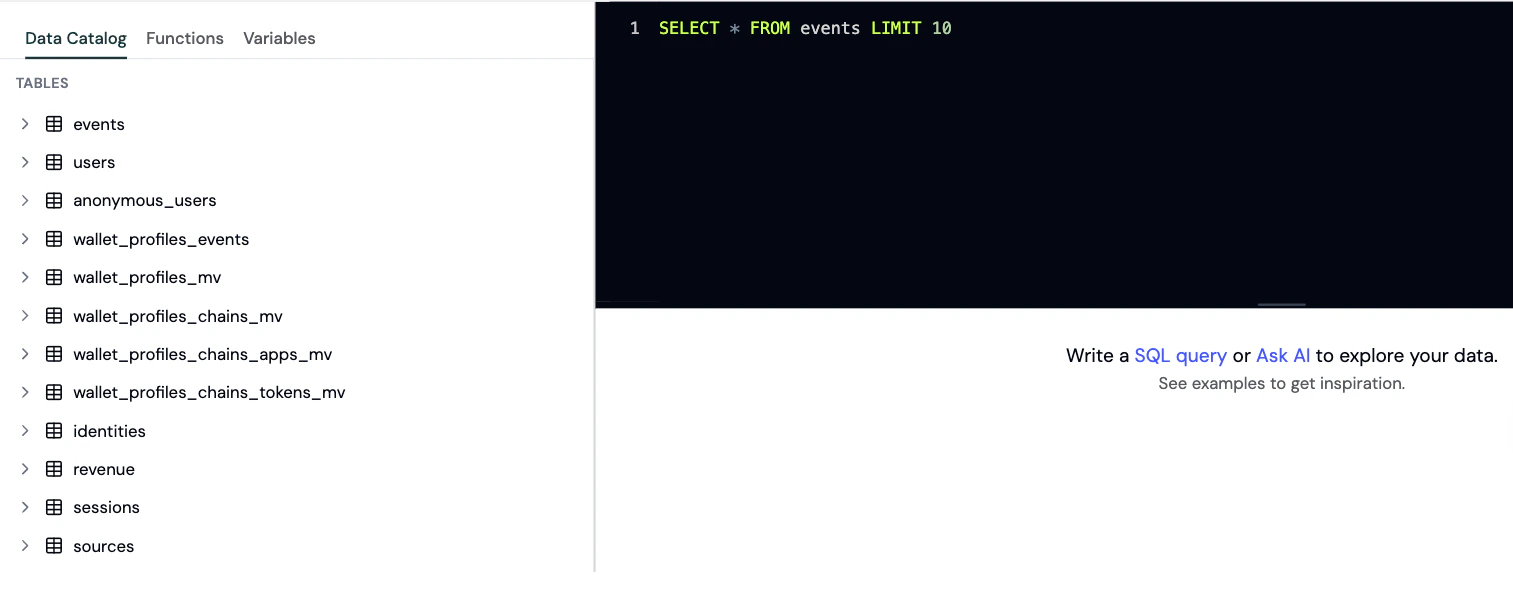
Step 2: Write your query
Enter your SQL query in the editor. Formo uses ClickHouse SQL syntax. Example: Daily active walletsStep 3: Run and visualize
- Click Run to execute your query
- View results in the table below
- Optionally, switch to chart view to visualize the data
Step 4: Export or save as a chart
- Export as CSV: Click Export to download your query results as a CSV file for offline analysis, reporting, or importing into other tools.
- Save as a custom chart: Turn any query into a reusable visualization on your Charts page - choose from line, bar, pie, table, and more.
Available tables
See the Data Catalog for the full list of tables, column definitions, query patterns, and example queries.Best practices
- Use
LIMITto control result size. Default is 100 rows; maximum is 1,000,000 rows - Use date filters to improve query performance
- See the Event Spec for available event properties
- Use Ask AI to help write and fix queries
Saving queries
After writing a useful query, save it as a chart on your custom dashboard:- On the Charts page, select an existing board or create a new one
- Add a new chart by clicking Add Chart
- Paste your query into the SQL editor and run it
- Choose a visualization type (line, bar, table, etc.)