Cohort Analysis
Insights runs a weekly cohort analysis that answers four key questions about your users:Acquisition Quality
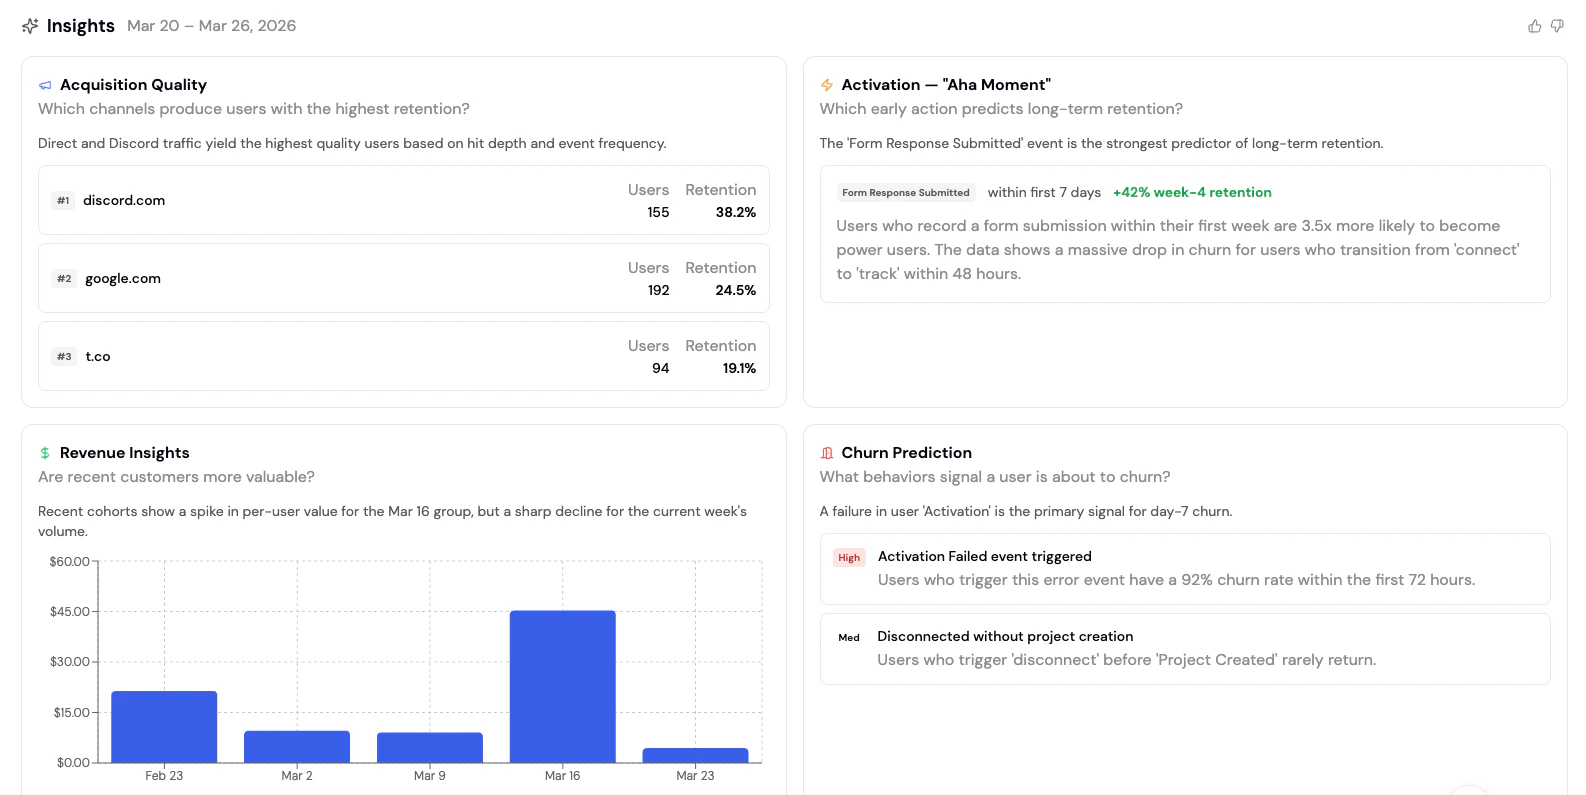
Which channels produce users with the highest retention? Acquisition Quality ranks your traffic sources by the retention rate of the users they bring in. Instead of optimizing for volume alone, you can identify which channels produce users that actually stick around. Each channel shows:| Column | Description |
|---|---|
| Channel | The traffic source (e.g., discord.com, google.com, t.co) |
| Users | Number of users acquired from this channel |
| Retention | Week-4 retention rate for users from this channel |
Activation - “Aha Moment”
Which early action predicts long-term retention? Activation identifies the single event within a user’s first few days that most strongly predicts long-term retention. This is the “aha moment” - the action that separates users who stay from those who churn. The insight shows:- The event that predicts retention (e.g., “Form Response Submitted”)
- Time window for the action (e.g., “within first 7 days”)
- Retention lift compared to users who don’t perform this action (e.g., “+42% week-4 retention”)
Revenue Insights
Are recent customers more valuable? Revenue Insights compares per-user value across weekly cohorts so you can spot whether your product changes are attracting higher-value users or if value is declining. The chart displays:- Weekly cohorts on the x-axis
- Average value per user on the y-axis
- Trend analysis highlighting spikes and declines
Churn Prediction
What behaviors signal a user is about to churn? Churn Prediction surfaces early warning signals - specific user behaviors that precede churn. Each signal includes a risk level and a description of what the data shows.| Column | Description |
|---|---|
| Behavior | The action or pattern that precedes churn |
| Risk Level | High, Medium, or Low severity |
| Description | What the data shows about this signal |
- High risk: “Users who trigger an error event have a 92% churn rate within the first 72 hours”
- Medium risk: “Users who disconnect before completing onboarding rarely return”
Weekly Summary
In addition to cohort analysis, the Insights page provides a weekly summary organized into four sections:- 🏆 Wins - Metrics that improved this week, with deltas and baselines
- ⚠️ Issues - Performance drops or problems that need attention
- 📈 Opportunities - Untapped segments or behaviors with estimated upside
- ✅ Actions - Concrete action items with priority levels (High/Med/Low) and success metrics
How to use Insights
- Navigate to the Formo Dashboard
- Select your project
- Click Insights in the left navigation (✨ sparkle icon)
- Insights are generated automatically each week - review the latest analysis and take action
Insights are generated using AI analysis of your actual analytics data. Results are cached daily and refresh automatically each week.
Combining Insights with other features
| Insight | Follow-up action |
|---|---|
| Low-quality acquisition channel | Create a segment of users from that channel to investigate |
| Aha moment identified | Build a funnel to measure how many users reach that event |
| Revenue decline in recent cohorts | Use retention analysis to understand drop-off patterns |
| High churn signal detected | Set up an alert to notify you when users exhibit that behavior |
| Behavioral gap between power and casual users | Explore the gap using Ask Formo or the Explorer |
Next Steps
Retention
Dive deeper into cohort retention patterns
Funnels
Measure conversion toward your aha moment
User Segments
Create segments based on insight findings
Alerts
Get notified when churn signals are detected