

Part 1: Open Ask AI
Click “Ask AI” in the left sidebar (chat bubble icon) to open the chat interface. You’ll see your conversation history on the left and the chat window on the right.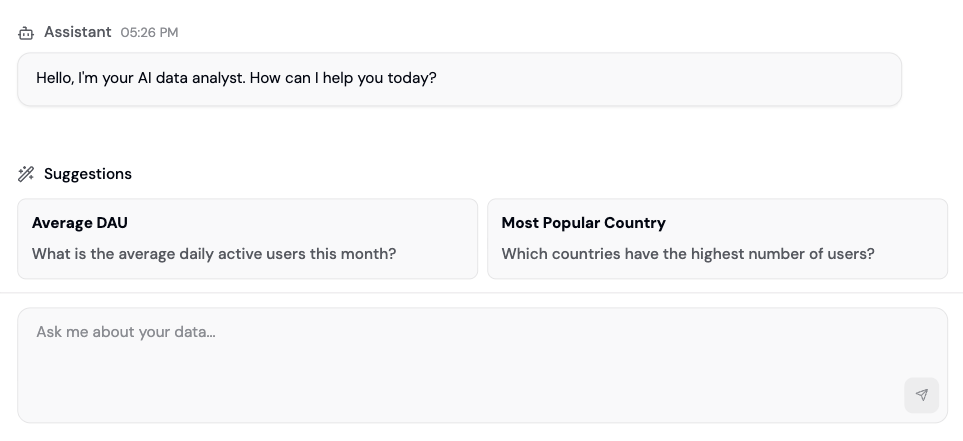
Part 2: Ask Your First Question
Start with something straightforward. Click in the message box and type a question: Example: “How many unique wallets connected this week?” Hit enter. The AI will:- Parse your question
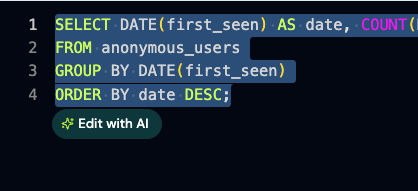
- Generate a SQL query from it
- Run the query against your data
- Return an answer, with a chart when relevant
Part 3: Understand the Response
Each Ask AI response includes:- A plain English answer summarizing what the data shows
- A chart or dashboard proposal, when the question calls for one
- “How I calculated this”: a collapsible section showing the SQL and tool calls the AI used to get the answer
Part 4: Ask Follow-Up Questions
Ask follow-ups without repeating context: You: “How many unique wallets connected this week?” AI: [Shows 12,453 wallets] You: “How many of those were new?” AI: [Filters to new wallets. Understands “those” = the wallets from last question] You: “What were their top referral sources?” AI: [Breaks down new wallets by referrer. Still understands the context] The AI maintains conversation memory, so each question builds on the previous one. No need to re-ask context.Part 5: Use the Insights Page for Automated Analysis
Beyond Ask AI, visit Insights in the sidebar for AI-generated analysis of your app. It has two parts: a summary of wins, issues, and opportunities, and a cohort analysis across acquisition, revenue, and churn. See Insights for the full breakdown.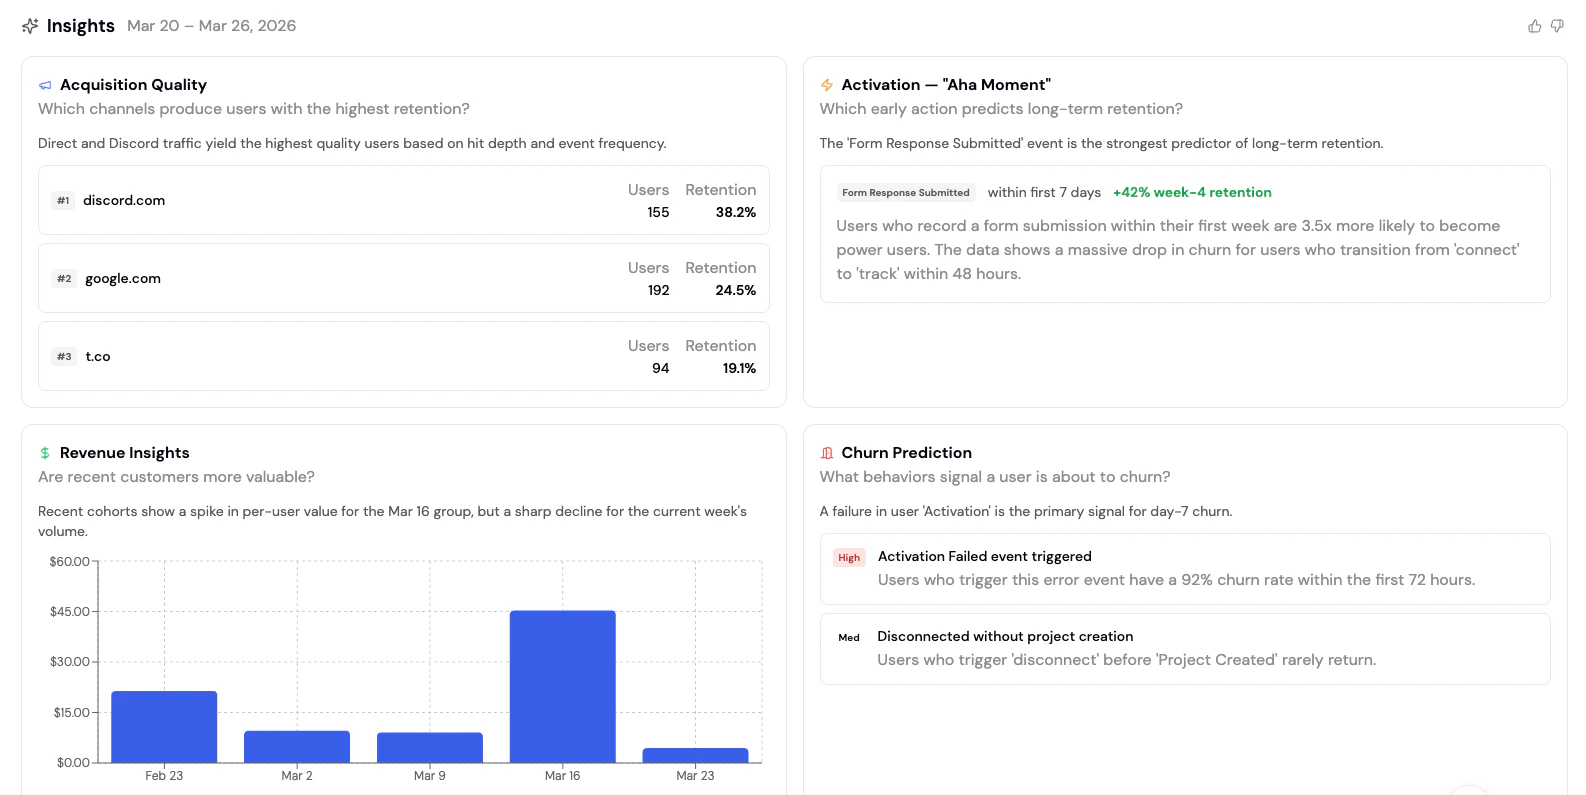
Part 6: Save Your Questions as Dashboards
To check a question weekly instead of re-asking it:- Ask your question in Ask AI
- Click Add to Dashboard
- Choose an existing board (or it saves directly if you only have one)
Example Questions
Be specific with dates and metrics. Instead of “How are we doing?” try “What’s my DAU compared to last week?” or “Show me conversion by traffic source for the last 30 days.”
User acquisition
Prompt: “Where are my users coming from this month?” What you’ll learn: Top referrers, UTM sources, and traffic channels. Follow-up: “Which referrer has the best conversion rate?”Active users
Prompt: “How many active users did we have last week?” What you’ll learn: DAU trend with day-over-day changes. Follow-up: “Show me daily active wallets for the last 30 days and compare to the previous 30 days”Conversion funnel
Prompt: “What percentage of visitors connect their wallet?” What you’ll learn: Top-of-funnel conversion rate. Follow-up: “Of those who connect, how many complete a transaction?”User retention
Prompt: “What’s my week-1 retention rate?” What you’ll learn: How many users return after their first visit. Follow-up: “Show me retention by acquisition source”Revenue analysis
Prompt: “What’s our daily revenue trend for the past month?” What you’ll learn: Revenue/volume metrics and trends. Follow-up: “Break this down by day of week”User segments
Prompt: “Which customers have the highest usage?” What you’ll learn: High-value user identification and behavior patterns. Follow-up: “How many whales (net worth > $100k) do I have, and what’s their average transaction volume?”Geographic distribution
Prompt: “Which countries have the most active users?” What you’ll learn: Geographic breakdown of your user base. Follow-up: “Which country has the highest average transaction value?”Feature adoption
Prompt: “How many users visited the /stake page this week?” What you’ll learn: Feature page traffic. Follow-up: “Of those, how many completed a staking transaction?”Drop-off analysis
Prompt: “Where do users drop off in the transaction flow?” What you’ll learn: Conversion bottlenecks. Follow-up: “Is drop-off higher on mobile or desktop?”Anomaly detection
Prompt: “Are there any unusual patterns in my data this week?” What you’ll learn: Spikes, drops, or outliers worth investigating. Follow-up: “What might have caused the spike on Tuesday?”Acquisition quality
Prompt: “Which channels produce users with the highest retention?” What you’ll learn: Which acquisition sources bring the best long-term users. Follow-up: “Correlate signup source with 30-day retention: which acquisition channels have the best retention rates?”Activation
Prompt: “Which early action predicts long-term retention?” What you’ll learn: The “aha moment” event that separates retained users from churned ones. Follow-up: “What percentage of users complete that action in their first session?”Revenue cohorts
Prompt: “Are recent customers more valuable?” What you’ll learn: Whether newer cohorts are spending more or less than older ones. Follow-up: “Break down average revenue per user by weekly cohort”Behavioral insights
Prompt: “What do power users do that casual users don’t?” What you’ll learn: Behaviors that differentiate high-value users from the rest. Follow-up: “Which features have the biggest usage gap between power and casual users?”Churn prediction
Prompt: “What behaviors signal a user is about to churn?” What you’ll learn: Early warning signals for at-risk users. Follow-up: “Find the top 10 users by session count, show their activity over time, and flag any that look like potential churns”Other questions
Revenue attribution:“Which UTM campaign drove the most transaction volume?”Competitive insights:
“How many of my users also use Uniswap?”Time patterns:
“What time of day do most transactions happen?”Platform comparison:
“How does mobile vs desktop conversion compare?”
Best Practices
FAQ
Does the AI have access to all my data?
Does the AI have access to all my data?
Yes, Ask AI can query all events, properties, and custom SQL tables in your project schema. It respects your project’s permissions, so team members only see data they have access to.
How far back can I ask about historical data?
How far back can I ask about historical data?
You can query as far back as your project has data (usually from your first SDK install, months to years ago). Ask away: “Show me DAU for the last 6 months.”
Can I ask the AI to create a new event or property?
Can I ask the AI to create a new event or property?
No, Ask AI only reads and analyzes data. To create new events or properties, configure them in your SDK or contract events setup.