Understand your onchain users with audience insights.
- A breakdown of users by lifecycle stage
- Sessions and transactions per wallet
- A breakdown of users by net worth
- Lifetime volume, revenue, and points
- Wallet labels
Filters
Apply filters to understand how different segments of users interact with your app at different times.Filter by Lifecycle
Filter users by their lifecycle stage to create segments: New, Power User, Resurrected, At Risk, Returning, Churned.Filter by Apps, Tokens, Chains
Apply filters such as “users who use app X and Y” for apps, tokens, and chains, combining multiple filters into one segment.Filter by First-Touch and Last-Touch Attribution
Filter users by referrer, referral, and UTM properties using first-touch and last-touch attribution. Understand which channels first introduced users to your app versus which channels drove the final conversion.Filter by App and Token Amounts
Filter users’ apps and tokens by specific amounts. For example, “Show me users of Ethena with more than $1000 balance.”How to analyze your user base
Audience Insights gives you a bird’s-eye view of who your users are. This section covers exploring your audience composition and building segments from it.Step 1: Open Audience Insights
- Go to the Formo Dashboard
- Select your project
- Click Users in the left navigation
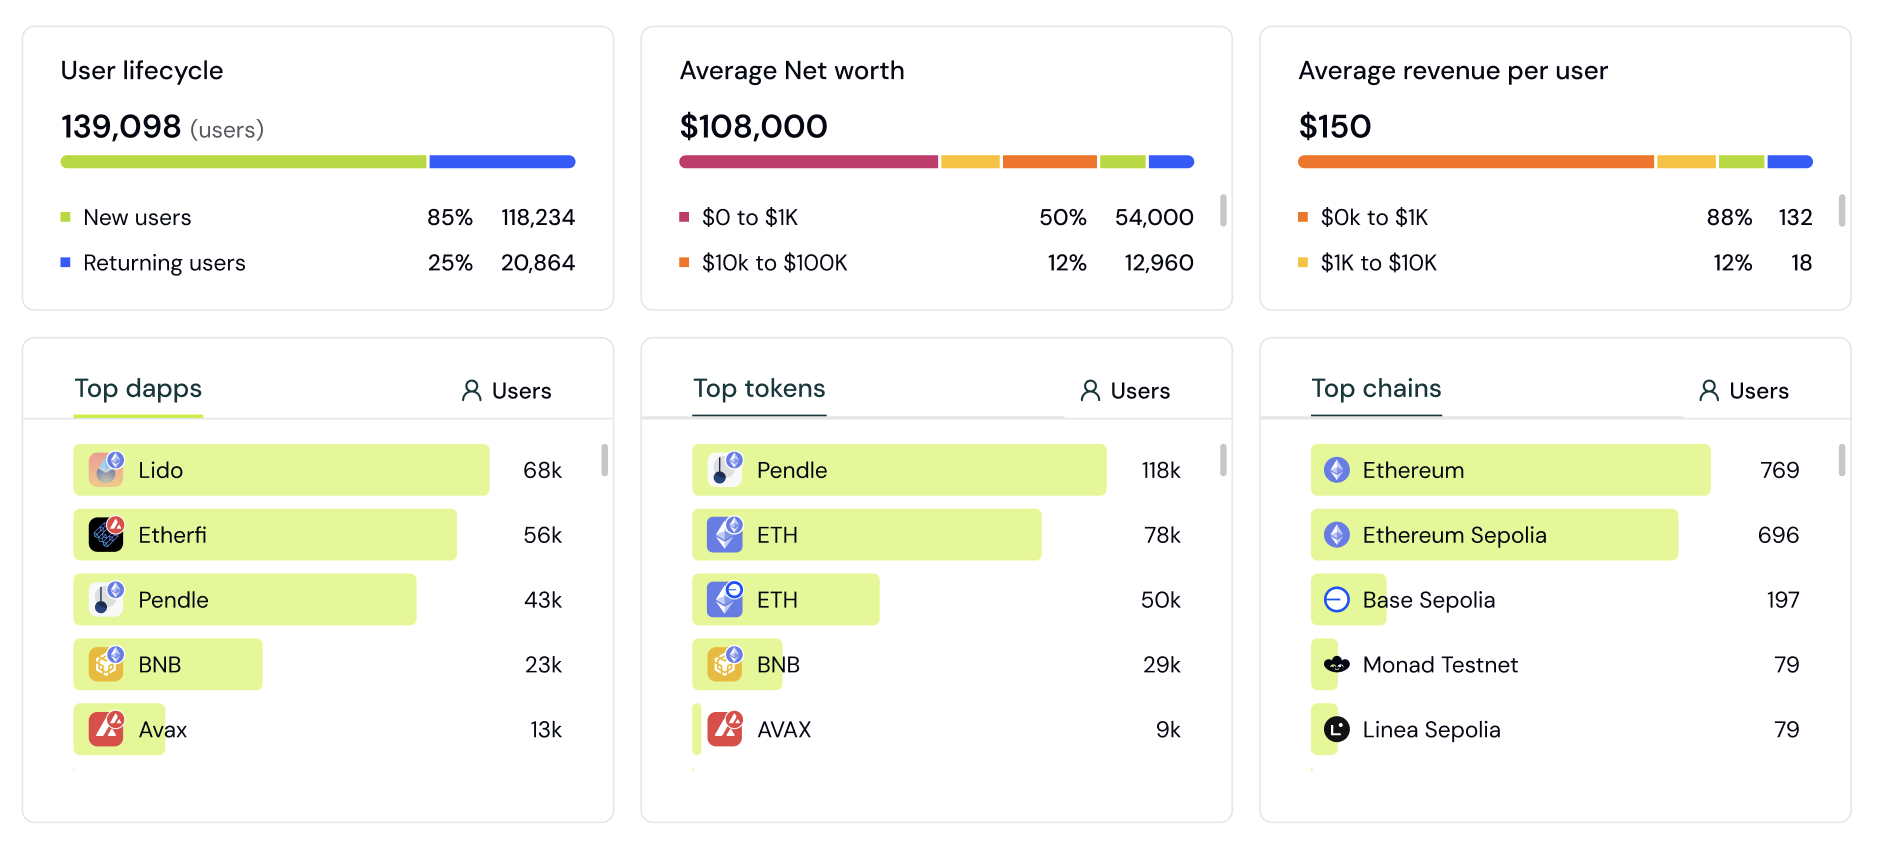
Step 2: Explore the overview charts
The dashboard shows key breakdowns of your audience:See aggregate onchain data for your entire user base.
Step 3: Apply filters to segment
Click Filter to narrow down to specific user groups: Example: Find your most valuable DeFi users
Example: Find users from a specific campaign
Example: Find whales who use competitor apps
Step 4: Analyze filtered results
After applying filters, the charts update to show only matching users:- Compare segments: How do Twitter users differ from Discord users?
- Find opportunities: Which tokens do your whales hold that you don’t support yet?
- Identify patterns: What apps do your power users have in common?
Step 5: Save as a segment
Turn useful filter combinations into reusable segments:- Apply your filters
- Click Save Segment
- Name your segment (e.g., “High-Value DeFi Users”)
- Reapply it anytime from the Segment dropdown next to the filter bar; see Segments
Common analysis workflows
Understand your best users:- Filter by Lifecycle = “Power user”
- Filter by Apps or Tokens to see what they hold and use
- Identify common characteristics to target in acquisition
- Filter by UTM Source, Referrer, or Referral to your campaign
- Compare net worth distribution to overall average
- Check if campaign users have higher/lower value
- Filter by Chains to see which networks your users are active on
- Identify chains you don’t fully support yet
- Prioritize based on user demand
- Filter by Apps to select competitor apps
- See how many of your users also use competitors
- Understand what else these users are doing