> ## Documentation Index
> Fetch the complete documentation index at: https://docs.formo.so/llms.txt
> Use this file to discover all available pages before exploring further.
# How to Query Your Data with the SQL Explorer
> Write custom ClickHouse SQL queries against your Formo analytics data to build reports, export results, and connect external BI tools like Metabase and Grafana.
Dashboards show what builders thought you'd want. SQL lets you ask anything.
The SQL Explorer is your direct line to Formo's analytics database. Write custom queries in ClickHouse SQL, visualize results, export as CSV, and connect external BI tools. If dashboards don't have what you need, SQL does.
## Part 1: Navigate to Explorer
Click **Explorer** in the sidebar. You'll see:
* **Left panel**: Schema browser with tables and columns
* **Center panel**: SQL editor with syntax highlighting
* **Bottom panel**: Results table with pagination and export options
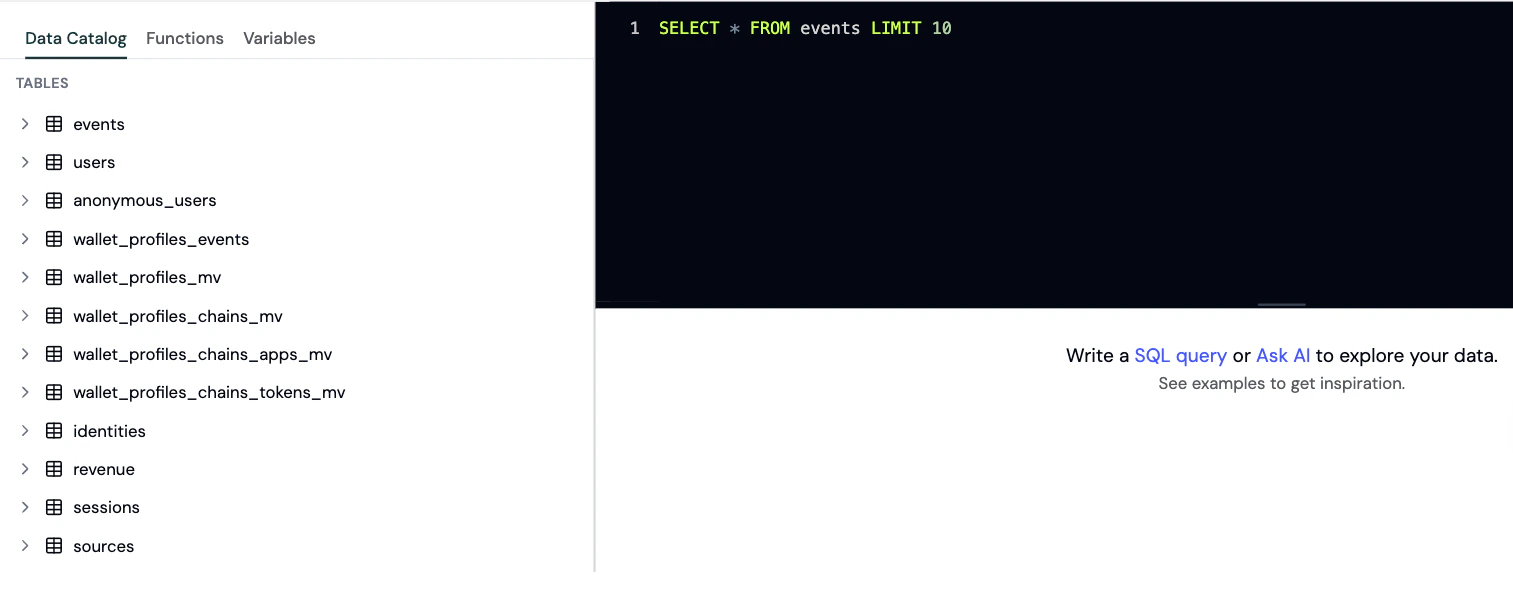 Start with an empty editor. The schema is your reference guide.
## Part 2: Browse the Schema
The schema browser shows 3 main tables:
### events
All tracked events (page views, contract events, custom events)
Key columns:
* `timestamp`: When event occurred (DateTime)
* `type`: Event category (LowCardinality String): 'page', 'connect', 'transaction', 'decoded\_log', 'track', etc.
* `event`: Specific event name for 'track' and 'decoded\_log' types (e.g., 'swap', 'Transfer')
* `session_id`: User's session identifier
* `anonymous_id`: Anonymous user ID (for unconnected wallets)
* `address`: Connected wallet address (null if not connected)
* `page_path`: Page path (e.g., `/swap`)
* `page_url`: Full page URL
* `page_title`: Page title
* `referrer`: Referrer header
* `referrer_url`: Referrer URL
* `utm_source`, `utm_medium`, `utm_campaign`: Attribution data
* `properties`: JSON string with event-specific data (chain\_id, tx\_hash, etc. stored here)
* `volume`, `revenue`, `points`: Float32 columns extracted from `properties` at ingest (values >100M zeroed as anomalies). Query these flat columns rather than `JSONExtractFloat(properties, ...)`
* `location`: Country/geo (LowCardinality String)
* `device`: Device type (LowCardinality String)
* `browser`: Browser name (LowCardinality String)
### users
Identified users (wallet addresses with aggregate data)
Key columns:
* `address`: Primary key (wallet address)
* `first_seen`: First activity timestamp (SimpleAggregateFunction)
* `last_seen`: Most recent activity (SimpleAggregateFunction)
* `num_sessions`: Total sessions (AggregateFunction - access via `uniqMerge(num_sessions)`)
* `revenue`: Total revenue (SimpleAggregateFunction sum)
* `volume`: Total volume (SimpleAggregateFunction sum)
* `points`: Total points (SimpleAggregateFunction sum)
* `activity_dates`: Lifecycle calculation data (AggregateFunction)
* `first_utm_source`, `last_utm_source`, etc.: Attribution (AggregateFunction - access via argMinMerge/argMaxMerge)
### anonymous\_users
Unidentified users (visitors who haven't connected wallets)
Key columns:
* `anonymous_id`: Primary key
* `first_seen`, `last_seen`: Activity timestamps
* `num_sessions`: Total sessions (AggregateFunction - access via `uniqMerge(num_sessions)`)
Click any column name to insert it into your editor.
## Part 3: Write Your First Query
Start simple. Click on the `events` table in the schema, then click the `timestamp` column to insert it.
Write a basic query:
```sql theme={null}
SELECT
count(*) as event_count,
count(DISTINCT address) as unique_wallets
FROM events
WHERE timestamp >= now() - INTERVAL 7 DAY
```
Click **Run Query** or press Cmd+Enter. Results appear in the bottom panel.
This query shows: How many events and unique wallets in the last 7 days?
ClickHouse basics:
* `count(*)`: Total rows
* `count(DISTINCT column)`: Unique values
* `INTERVAL 7 DAY`: Time span
* `WHERE`: Filter rows
* `GROUP BY`: Aggregate by column
* `ORDER BY`: Sort results
## Part 4: 10 Essential Queries
### Query 1: Daily Active Users
How many unique users per day?
```sql theme={null}
SELECT
toDate(timestamp) as date,
count(DISTINCT address) as daily_active_users
FROM events
WHERE timestamp >= now() - INTERVAL 30 DAY
GROUP BY date
ORDER BY date DESC
```
### Query 2: Top Pages by Visits
Which pages drive the most traffic?
```sql theme={null}
SELECT
page_path,
count(*) as visits,
count(DISTINCT address) as unique_users
FROM events
WHERE type = 'page'
GROUP BY page_path
ORDER BY visits DESC
LIMIT 10
```
### Query 3: Wallet Connect Rate
What % of visitors connect a wallet?
```sql theme={null}
SELECT
connected_wallets,
total_visitors,
round(100.0 * connected_wallets / total_visitors, 2) as connect_rate_percent
FROM (
SELECT
count(DISTINCT case when type = 'connect' then address end) as connected_wallets,
count(DISTINCT anonymous_id) as total_visitors
FROM events
)
```
### Query 4: Transaction Volume by Day
How much onchain activity (by event count)?
```sql theme={null}
SELECT
toDate(timestamp) as date,
count(*) as transaction_count,
count(DISTINCT address) as transacting_wallets
FROM events
WHERE type = 'decoded_log' AND event IN ('Swap', 'Transfer', 'Approve')
GROUP BY date
ORDER BY date DESC
```
### Query 5: Users by Referral Source
Where do your best users come from?
```sql theme={null}
SELECT
utm_source,
count(*) as users
FROM (
SELECT
address,
argMaxMerge(last_utm_source) as utm_source
FROM users
GROUP BY address
)
WHERE utm_source != ''
GROUP BY utm_source
ORDER BY users DESC
```
### Query 6: Average Sessions Before First Transaction
How many visits before users buy?
```sql theme={null}
SELECT
avg(sessions) as avg_sessions
FROM (
SELECT
address,
uniqMerge(num_sessions) as sessions
FROM users
WHERE address IN (
SELECT DISTINCT address
FROM events
WHERE type = 'decoded_log' AND event IN ('Swap', 'Transfer')
)
GROUP BY address
)
```
### Query 7: New vs Returning Users
What's your retention?
```sql theme={null}
SELECT
user_type,
count(*) as count
FROM (
SELECT
address,
case
when uniqMerge(num_sessions) = 1 then 'New'
when uniqMerge(num_sessions) <= 10 then 'Returning'
else 'Power User'
end as user_type
FROM users
WHERE first_seen >= now() - INTERVAL 30 DAY
GROUP BY address
)
GROUP BY user_type
```
### Query 8: Whale Analysis
Which wallet addresses have the highest volume?
```sql theme={null}
SELECT
address,
sum(volume) as total_volume,
sum(revenue) as total_revenue,
uniqMerge(num_sessions) as sessions
FROM users
WHERE volume > 0
GROUP BY address
ORDER BY total_volume DESC
LIMIT 10
```
Note: Wallet labels are stored in the separate `wallet_profiles` table, not in the users table.
### Query 9: Volume by UTM Campaign
Which campaigns drive the most onchain volume?
```sql theme={null}
SELECT
utm_source,
utm_campaign,
count(DISTINCT case when type = 'decoded_log' AND event = 'Swap' then address end) as converters,
count(*) as swap_count
FROM events
WHERE type = 'decoded_log' AND event = 'Swap' AND utm_source IS NOT NULL
GROUP BY utm_source, utm_campaign
ORDER BY swap_count DESC
```
### Query 10: Hourly Activity Heatmap
When are your users most active?
```sql theme={null}
SELECT
toHour(timestamp) as hour_of_day,
count(*) as events,
count(DISTINCT address) as active_wallets
FROM events
WHERE timestamp >= now() - INTERVAL 7 DAY
GROUP BY hour_of_day
ORDER BY hour_of_day
```
## Part 5: Visualize Results
After running a query, results appear in a table. Click **Visualize** to see options:
* **Line Chart**: Trends over time
* **Bar Chart**: Comparisons across categories
* **Pie Chart**: Proportions
* **Number Card**: Single metric
* **Table**: Raw data
Select the appropriate chart type for your query. For example, Query 1 (daily active users) works great as a line chart.
## Part 6: Export Results as CSV
Click **Export** in the results panel. Formo downloads a CSV file with all rows.
Use exported data for:
* Reports to stakeholders
* Import into Excel for further analysis
* Feed into other tools (BI dashboards, email lists, etc.)
CSV exports include all columns in your SELECT statement.
## Part 7: Ask Formo to Generate SQL
Don't want to write SQL? Use Formo's AI.
Click **Ask Formo** (chat bubble in sidebar). Describe what you want in plain English:
"Show me users who completed 5+ swaps in the last 14 days and have net worth >\$100k"
Ask Formo generates ClickHouse SQL automatically and runs it. You can refine with follow-up questions:
"Sort by session count descending"
"Export as CSV"
See [How to use Ask Formo](/guides/ask-ai) for details.
## Part 8: Connect BI Tools
Formo's SQL engine integrates with external BI tools via the **Query API**.
Supported tools:
* Metabase
* Grafana
* Tableau
* Looker
* Power BI
* Custom integrations
Configuration details are at [/data/bi](/data/bi). You'll need your API key from [Workspace Settings > API Keys](/api/authentication).
Example Metabase connection:
1. In Metabase, click Settings > Databases > Add Database
2. Choose "ClickHouse"
3. Paste your Formo ClickHouse credentials (provided in workspace settings)
4. Create queries and dashboards in Metabase that query your Formo data
Your BI tool becomes another analytics interface alongside Formo dashboards.
## Best Practices
### Click Schema Columns to Insert
In the left panel, click any column name and it auto-inserts into your query. Faster than typing.
### Use CTEs for Readability
Break complex queries into steps using `WITH` clauses:
```sql theme={null}
WITH first_transactions AS (
SELECT
address,
min(timestamp) as first_tx_time
FROM events
WHERE type = 'decoded_log' AND event = 'Swap'
GROUP BY address
)
SELECT
address,
first_tx_time
FROM first_transactions
ORDER BY first_tx_time DESC
```
### Use Autocomplete
Start typing a column name and press Ctrl+Space. Formo suggests matching columns.
### Save Query Results as Charts
After running a query, click **Save as Chart**. Add to a dashboard. The chart updates in real time with new data.
### Filter for Performance
Large queries over 1 year of data can slow down. Always add `WHERE timestamp >= ...` to limit the range.
## Next Steps
SQL opens doors to custom analysis:
* See [How to Build a Custom Dashboard](/guides/custom-dashboard) for dashboard best practices
* Learn [How to Analyze Conversion Funnels](/guides/funnels) for funnels
* Explore [Attribution Guide](/guides/onchain-attribution) for UTM analysis
For SQL syntax help, see [ClickHouse Documentation](https://clickhouse.com/docs/en/intro).
## FAQ
Formo uses ClickHouse SQL. It's close to standard SQL but has some differences (e.g., `arrayJoin` for arrays, `toDate()` for timestamps). See ClickHouse docs for syntax details.
No. Each project has its own isolated database. Write queries for one project at a time. If you need cross-project analysis, contact support.
Queries timeout after 120 seconds. Most queries finish in seconds. If yours is slow, add a `WHERE timestamp >= ...` filter to reduce the dataset.
Yes. Use standard SQL joins:
```sql theme={null}
SELECT e.type, e.event, u.address
FROM events e
JOIN users u ON e.address = u.address
```
Yes. Ask Formo understands ClickHouse syntax and functions. If you ask for something like "top 10 items", it generates optimized ClickHouse queries automatically.
Yes. Both subqueries and CTEs (WITH clauses) are supported. CTEs are recommended for readability in complex queries.
Custom events appear in the `events` table with `type = 'track'` and the event name in the `event` column. Filter like: `WHERE type = 'track' AND event = 'My Custom Event'`.
Start with an empty editor. The schema is your reference guide.
## Part 2: Browse the Schema
The schema browser shows 3 main tables:
### events
All tracked events (page views, contract events, custom events)
Key columns:
* `timestamp`: When event occurred (DateTime)
* `type`: Event category (LowCardinality String): 'page', 'connect', 'transaction', 'decoded\_log', 'track', etc.
* `event`: Specific event name for 'track' and 'decoded\_log' types (e.g., 'swap', 'Transfer')
* `session_id`: User's session identifier
* `anonymous_id`: Anonymous user ID (for unconnected wallets)
* `address`: Connected wallet address (null if not connected)
* `page_path`: Page path (e.g., `/swap`)
* `page_url`: Full page URL
* `page_title`: Page title
* `referrer`: Referrer header
* `referrer_url`: Referrer URL
* `utm_source`, `utm_medium`, `utm_campaign`: Attribution data
* `properties`: JSON string with event-specific data (chain\_id, tx\_hash, etc. stored here)
* `volume`, `revenue`, `points`: Float32 columns extracted from `properties` at ingest (values >100M zeroed as anomalies). Query these flat columns rather than `JSONExtractFloat(properties, ...)`
* `location`: Country/geo (LowCardinality String)
* `device`: Device type (LowCardinality String)
* `browser`: Browser name (LowCardinality String)
### users
Identified users (wallet addresses with aggregate data)
Key columns:
* `address`: Primary key (wallet address)
* `first_seen`: First activity timestamp (SimpleAggregateFunction)
* `last_seen`: Most recent activity (SimpleAggregateFunction)
* `num_sessions`: Total sessions (AggregateFunction - access via `uniqMerge(num_sessions)`)
* `revenue`: Total revenue (SimpleAggregateFunction sum)
* `volume`: Total volume (SimpleAggregateFunction sum)
* `points`: Total points (SimpleAggregateFunction sum)
* `activity_dates`: Lifecycle calculation data (AggregateFunction)
* `first_utm_source`, `last_utm_source`, etc.: Attribution (AggregateFunction - access via argMinMerge/argMaxMerge)
### anonymous\_users
Unidentified users (visitors who haven't connected wallets)
Key columns:
* `anonymous_id`: Primary key
* `first_seen`, `last_seen`: Activity timestamps
* `num_sessions`: Total sessions (AggregateFunction - access via `uniqMerge(num_sessions)`)
Click any column name to insert it into your editor.
## Part 3: Write Your First Query
Start simple. Click on the `events` table in the schema, then click the `timestamp` column to insert it.
Write a basic query:
```sql theme={null}
SELECT
count(*) as event_count,
count(DISTINCT address) as unique_wallets
FROM events
WHERE timestamp >= now() - INTERVAL 7 DAY
```
Click **Run Query** or press Cmd+Enter. Results appear in the bottom panel.
This query shows: How many events and unique wallets in the last 7 days?
ClickHouse basics:
* `count(*)`: Total rows
* `count(DISTINCT column)`: Unique values
* `INTERVAL 7 DAY`: Time span
* `WHERE`: Filter rows
* `GROUP BY`: Aggregate by column
* `ORDER BY`: Sort results
## Part 4: 10 Essential Queries
### Query 1: Daily Active Users
How many unique users per day?
```sql theme={null}
SELECT
toDate(timestamp) as date,
count(DISTINCT address) as daily_active_users
FROM events
WHERE timestamp >= now() - INTERVAL 30 DAY
GROUP BY date
ORDER BY date DESC
```
### Query 2: Top Pages by Visits
Which pages drive the most traffic?
```sql theme={null}
SELECT
page_path,
count(*) as visits,
count(DISTINCT address) as unique_users
FROM events
WHERE type = 'page'
GROUP BY page_path
ORDER BY visits DESC
LIMIT 10
```
### Query 3: Wallet Connect Rate
What % of visitors connect a wallet?
```sql theme={null}
SELECT
connected_wallets,
total_visitors,
round(100.0 * connected_wallets / total_visitors, 2) as connect_rate_percent
FROM (
SELECT
count(DISTINCT case when type = 'connect' then address end) as connected_wallets,
count(DISTINCT anonymous_id) as total_visitors
FROM events
)
```
### Query 4: Transaction Volume by Day
How much onchain activity (by event count)?
```sql theme={null}
SELECT
toDate(timestamp) as date,
count(*) as transaction_count,
count(DISTINCT address) as transacting_wallets
FROM events
WHERE type = 'decoded_log' AND event IN ('Swap', 'Transfer', 'Approve')
GROUP BY date
ORDER BY date DESC
```
### Query 5: Users by Referral Source
Where do your best users come from?
```sql theme={null}
SELECT
utm_source,
count(*) as users
FROM (
SELECT
address,
argMaxMerge(last_utm_source) as utm_source
FROM users
GROUP BY address
)
WHERE utm_source != ''
GROUP BY utm_source
ORDER BY users DESC
```
### Query 6: Average Sessions Before First Transaction
How many visits before users buy?
```sql theme={null}
SELECT
avg(sessions) as avg_sessions
FROM (
SELECT
address,
uniqMerge(num_sessions) as sessions
FROM users
WHERE address IN (
SELECT DISTINCT address
FROM events
WHERE type = 'decoded_log' AND event IN ('Swap', 'Transfer')
)
GROUP BY address
)
```
### Query 7: New vs Returning Users
What's your retention?
```sql theme={null}
SELECT
user_type,
count(*) as count
FROM (
SELECT
address,
case
when uniqMerge(num_sessions) = 1 then 'New'
when uniqMerge(num_sessions) <= 10 then 'Returning'
else 'Power User'
end as user_type
FROM users
WHERE first_seen >= now() - INTERVAL 30 DAY
GROUP BY address
)
GROUP BY user_type
```
### Query 8: Whale Analysis
Which wallet addresses have the highest volume?
```sql theme={null}
SELECT
address,
sum(volume) as total_volume,
sum(revenue) as total_revenue,
uniqMerge(num_sessions) as sessions
FROM users
WHERE volume > 0
GROUP BY address
ORDER BY total_volume DESC
LIMIT 10
```
Note: Wallet labels are stored in the separate `wallet_profiles` table, not in the users table.
### Query 9: Volume by UTM Campaign
Which campaigns drive the most onchain volume?
```sql theme={null}
SELECT
utm_source,
utm_campaign,
count(DISTINCT case when type = 'decoded_log' AND event = 'Swap' then address end) as converters,
count(*) as swap_count
FROM events
WHERE type = 'decoded_log' AND event = 'Swap' AND utm_source IS NOT NULL
GROUP BY utm_source, utm_campaign
ORDER BY swap_count DESC
```
### Query 10: Hourly Activity Heatmap
When are your users most active?
```sql theme={null}
SELECT
toHour(timestamp) as hour_of_day,
count(*) as events,
count(DISTINCT address) as active_wallets
FROM events
WHERE timestamp >= now() - INTERVAL 7 DAY
GROUP BY hour_of_day
ORDER BY hour_of_day
```
## Part 5: Visualize Results
After running a query, results appear in a table. Click **Visualize** to see options:
* **Line Chart**: Trends over time
* **Bar Chart**: Comparisons across categories
* **Pie Chart**: Proportions
* **Number Card**: Single metric
* **Table**: Raw data
Select the appropriate chart type for your query. For example, Query 1 (daily active users) works great as a line chart.
## Part 6: Export Results as CSV
Click **Export** in the results panel. Formo downloads a CSV file with all rows.
Use exported data for:
* Reports to stakeholders
* Import into Excel for further analysis
* Feed into other tools (BI dashboards, email lists, etc.)
CSV exports include all columns in your SELECT statement.
## Part 7: Ask Formo to Generate SQL
Don't want to write SQL? Use Formo's AI.
Click **Ask Formo** (chat bubble in sidebar). Describe what you want in plain English:
"Show me users who completed 5+ swaps in the last 14 days and have net worth >\$100k"
Ask Formo generates ClickHouse SQL automatically and runs it. You can refine with follow-up questions:
"Sort by session count descending"
"Export as CSV"
See [How to use Ask Formo](/guides/ask-ai) for details.
## Part 8: Connect BI Tools
Formo's SQL engine integrates with external BI tools via the **Query API**.
Supported tools:
* Metabase
* Grafana
* Tableau
* Looker
* Power BI
* Custom integrations
Configuration details are at [/data/bi](/data/bi). You'll need your API key from [Workspace Settings > API Keys](/api/authentication).
Example Metabase connection:
1. In Metabase, click Settings > Databases > Add Database
2. Choose "ClickHouse"
3. Paste your Formo ClickHouse credentials (provided in workspace settings)
4. Create queries and dashboards in Metabase that query your Formo data
Your BI tool becomes another analytics interface alongside Formo dashboards.
## Best Practices
### Click Schema Columns to Insert
In the left panel, click any column name and it auto-inserts into your query. Faster than typing.
### Use CTEs for Readability
Break complex queries into steps using `WITH` clauses:
```sql theme={null}
WITH first_transactions AS (
SELECT
address,
min(timestamp) as first_tx_time
FROM events
WHERE type = 'decoded_log' AND event = 'Swap'
GROUP BY address
)
SELECT
address,
first_tx_time
FROM first_transactions
ORDER BY first_tx_time DESC
```
### Use Autocomplete
Start typing a column name and press Ctrl+Space. Formo suggests matching columns.
### Save Query Results as Charts
After running a query, click **Save as Chart**. Add to a dashboard. The chart updates in real time with new data.
### Filter for Performance
Large queries over 1 year of data can slow down. Always add `WHERE timestamp >= ...` to limit the range.
## Next Steps
SQL opens doors to custom analysis:
* See [How to Build a Custom Dashboard](/guides/custom-dashboard) for dashboard best practices
* Learn [How to Analyze Conversion Funnels](/guides/funnels) for funnels
* Explore [Attribution Guide](/guides/onchain-attribution) for UTM analysis
For SQL syntax help, see [ClickHouse Documentation](https://clickhouse.com/docs/en/intro).
## FAQ
Formo uses ClickHouse SQL. It's close to standard SQL but has some differences (e.g., `arrayJoin` for arrays, `toDate()` for timestamps). See ClickHouse docs for syntax details.
No. Each project has its own isolated database. Write queries for one project at a time. If you need cross-project analysis, contact support.
Queries timeout after 120 seconds. Most queries finish in seconds. If yours is slow, add a `WHERE timestamp >= ...` filter to reduce the dataset.
Yes. Use standard SQL joins:
```sql theme={null}
SELECT e.type, e.event, u.address
FROM events e
JOIN users u ON e.address = u.address
```
Yes. Ask Formo understands ClickHouse syntax and functions. If you ask for something like "top 10 items", it generates optimized ClickHouse queries automatically.
Yes. Both subqueries and CTEs (WITH clauses) are supported. CTEs are recommended for readability in complex queries.
Custom events appear in the `events` table with `type = 'track'` and the event name in the `event` column. Filter like: `WHERE type = 'track' AND event = 'My Custom Event'`.