> ## Documentation Index
> Fetch the complete documentation index at: https://docs.formo.so/llms.txt
> Use this file to discover all available pages before exploring further.
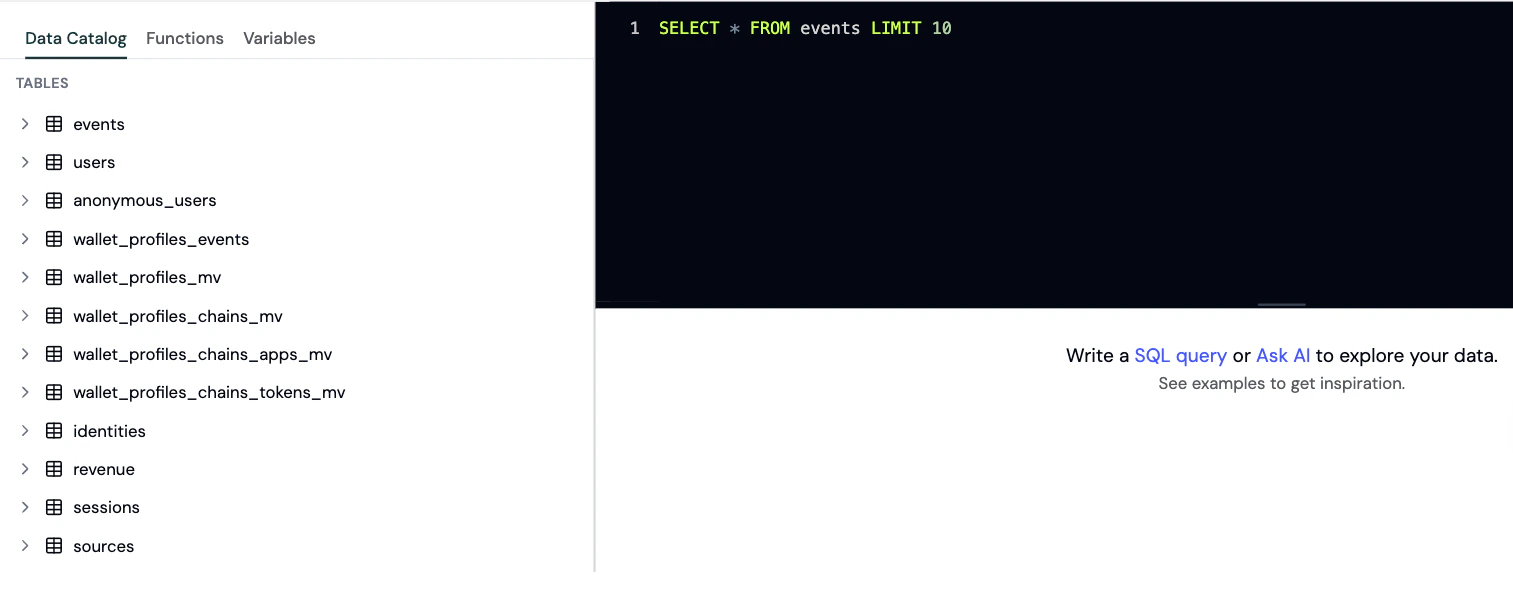
# Explorer
> Run custom ClickHouse SQL queries against your analytics data warehouse to build advanced reports, export results, and answer questions beyond dashboards.
The Explorer gives you direct SQL access to your analytics data. Run custom queries, build complex analyses, and answer questions that go beyond pre-built dashboards.
 ## When to use the Explorer
Use the Explorer when you need:
* **Ad-hoc analysis** for specific questions
* **Custom calculations** that aren't available in standard dashboards
* **Complex joins** across multiple data types
* **Testing queries** for custom charts and dashboards
* **Data validation** to verify metrics
## Running queries
### Step 1: Open the Explorer
1. Go to the [Formo Dashboard](https://app.formo.so)
2. Select your project
3. Click **Explorer** in the left navigation
### Step 2: Write your query
Enter your SQL query in the editor. Formo uses ClickHouse SQL syntax.
**Example: Daily active wallets**
```sql theme={null}
SELECT
toDate(timestamp) AS date,
countDistinct(address) AS daily_active_wallets
FROM events
WHERE type = 'connect'
AND timestamp >= now() - INTERVAL 30 DAY
GROUP BY date
ORDER BY date
```
### Step 3: Run and visualize
1. Click **Run** to execute your query
2. View results in the table below
3. Optionally, switch to chart view to visualize the data
### Step 4: Export or save as a chart
* **Export as CSV**: Click **Export** to download your query results as a CSV file for offline analysis, reporting, or importing into other tools.
* **Save as a custom chart**: Turn any query into a reusable visualization on your [Dashboards](/features/product-analytics/charts) page - choose from line, bar, pie, table, and more.
## Available tables
See the [Data Catalog](/data/catalog) for full column definitions, query patterns, and example queries for each table.
| Table | Description |
| ---------------------------------- | ------------------------------------------------------------------------------------------------ |
| `events` | All user interaction events (page views, wallet events, custom events, contract events) |
| `users` | Aggregated wallet user profiles identified by `address`, with attribution and engagement metrics |
| `anonymous_users` | Profiles for users who haven't connected a wallet yet, identified by `anonymous_id` |
| `identities` | Identity graph linking anonymous user IDs to wallet addresses and user IDs |
| `revenue` | Financial metrics and revenue with full attribution context |
| `sessions` | Aggregated user session data with engagement metrics and attribution |
| `sources` | Daily aggregated traffic source metrics and attribution data |
| `wallet_profiles_mv` | Comprehensive global wallet profile data aggregated across all chains |
| `wallet_profiles_chains_mv` | Wallet profile data broken down by individual blockchain networks |
| `wallet_profiles_chains_apps_mv` | Wallet DeFi application usage data broken down by blockchain |
| `wallet_profiles_chains_tokens_mv` | Wallet token holdings data broken down by blockchain |
| `wallet_profiles_events` | Timestamped wallet profiling events from external offchain and onchain analysis |
## Best practices
* Use `LIMIT` to control result size. Default is 1,000 rows; maximum is 1,000,000 rows
* Use date filters to improve query performance
* Reference the [Event Spec](/data/events/overview) for available event properties
* Use **Ask Formo** to help write and fix queries
## Saving queries
After writing a useful query, save it as a chart on your custom dashboard:
1. On the [Dashboards](/features/product-analytics/charts) page, select an existing board or create a new one
2. Add a new chart by clicking **Add Chart**
3. Paste your query into the SQL editor and run it
4. Choose a visualization type (line, bar, table, etc.)
Your query becomes a reusable chart on your dashboard that you can share with your team.
## Next steps
Save queries as custom charts
Understand available event properties
Let AI help write queries
Full data warehouse catalog
## When to use the Explorer
Use the Explorer when you need:
* **Ad-hoc analysis** for specific questions
* **Custom calculations** that aren't available in standard dashboards
* **Complex joins** across multiple data types
* **Testing queries** for custom charts and dashboards
* **Data validation** to verify metrics
## Running queries
### Step 1: Open the Explorer
1. Go to the [Formo Dashboard](https://app.formo.so)
2. Select your project
3. Click **Explorer** in the left navigation
### Step 2: Write your query
Enter your SQL query in the editor. Formo uses ClickHouse SQL syntax.
**Example: Daily active wallets**
```sql theme={null}
SELECT
toDate(timestamp) AS date,
countDistinct(address) AS daily_active_wallets
FROM events
WHERE type = 'connect'
AND timestamp >= now() - INTERVAL 30 DAY
GROUP BY date
ORDER BY date
```
### Step 3: Run and visualize
1. Click **Run** to execute your query
2. View results in the table below
3. Optionally, switch to chart view to visualize the data
### Step 4: Export or save as a chart
* **Export as CSV**: Click **Export** to download your query results as a CSV file for offline analysis, reporting, or importing into other tools.
* **Save as a custom chart**: Turn any query into a reusable visualization on your [Dashboards](/features/product-analytics/charts) page - choose from line, bar, pie, table, and more.
## Available tables
See the [Data Catalog](/data/catalog) for full column definitions, query patterns, and example queries for each table.
| Table | Description |
| ---------------------------------- | ------------------------------------------------------------------------------------------------ |
| `events` | All user interaction events (page views, wallet events, custom events, contract events) |
| `users` | Aggregated wallet user profiles identified by `address`, with attribution and engagement metrics |
| `anonymous_users` | Profiles for users who haven't connected a wallet yet, identified by `anonymous_id` |
| `identities` | Identity graph linking anonymous user IDs to wallet addresses and user IDs |
| `revenue` | Financial metrics and revenue with full attribution context |
| `sessions` | Aggregated user session data with engagement metrics and attribution |
| `sources` | Daily aggregated traffic source metrics and attribution data |
| `wallet_profiles_mv` | Comprehensive global wallet profile data aggregated across all chains |
| `wallet_profiles_chains_mv` | Wallet profile data broken down by individual blockchain networks |
| `wallet_profiles_chains_apps_mv` | Wallet DeFi application usage data broken down by blockchain |
| `wallet_profiles_chains_tokens_mv` | Wallet token holdings data broken down by blockchain |
| `wallet_profiles_events` | Timestamped wallet profiling events from external offchain and onchain analysis |
## Best practices
* Use `LIMIT` to control result size. Default is 1,000 rows; maximum is 1,000,000 rows
* Use date filters to improve query performance
* Reference the [Event Spec](/data/events/overview) for available event properties
* Use **Ask Formo** to help write and fix queries
## Saving queries
After writing a useful query, save it as a chart on your custom dashboard:
1. On the [Dashboards](/features/product-analytics/charts) page, select an existing board or create a new one
2. Add a new chart by clicking **Add Chart**
3. Paste your query into the SQL editor and run it
4. Choose a visualization type (line, bar, table, etc.)
Your query becomes a reusable chart on your dashboard that you can share with your team.
## Next steps
Save queries as custom charts
Understand available event properties
Let AI help write queries
Full data warehouse catalog